Double-click on an axis to open the Frame and Origin tab of the Format Axes dialog. Or click on the Format Axis tool in the Prism toolbar.
What values or labels show on the X axis?
XY graphs
Normally, of course, the X axis of an XY graph plots the X values you enter into the X column. The X axis, in this case, is numerical. If the X values are not evenly spaced, then the points won't be equally spaced.
If you enter row titles for each row, then you can choose to label the X axis with row titles rather than X values. Choose in the Number format drop down in the Regularly spaced ticks part of the Format Axes dialog.
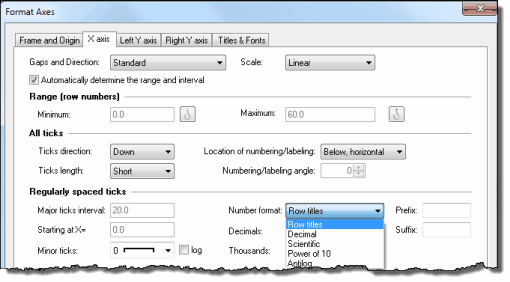
When you choose to label the X axis with row titles, the spacing of the points may change. Essentially, Prism uses the row number as the X value, so the points will be equally spaced along the X axis, even if the X values are not evenly spaced. By default, each row label will appear. If you have many rows, this will be cluttered. You can ask Prism to plot, say, every fifth row label by changing the major tick interval to 5, starting at 0. Keep in mind that Prism uses the row number (first row is 1) rather than the values entered into the X column, to position the data and determine which labels to show. Prism also uses this coordinate system (row numbers) when positioning additional ticks and grid lines. If you ask for a grid line at X=5, Prism will draw it to correspond with the point in the fifth row, whatever its X value.
If you entered elapsed times or dates instead of X values, Prism presents a different set of choices for Number format.
Grouped and contingency table graphs
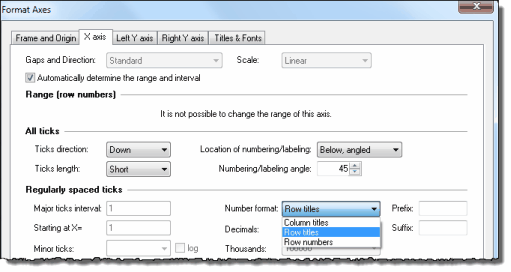
With Grouped graphs (and graphs of contingency tables), you can have a choice of labeling the X axis with row titles, column titles, or row number. You may or may not see all three choices, depending on how you configured your graph.
Other types of graphs
Survival graphs always use survival time as the X values. Column graphs always label the X axis with column titles. Parts-of-whole graphs don't have axes.
Appearance of axis numbers or labels
To change the font, size, and color of the numbering for one axis:
Go to the Titles and Fonts tab of the Format Axes dialog. Click the Font button in the Numbering or labeling section. Or select an axis by clicking on it, and use the Font settings in the toolbar.
To change the default font used for new graphs:
Set on the New Graphs tab of the Preferences dialog.
To move the numbers above/below the X-axis or to the right/left of the Y-axis:
Select the position of the axis numbering in the Axis Titles section on the Titles and Fonts tab of the Format Axes dialog. Or select the axis numbering by clicking once; then drag the numbering with the mouse or nudge it by clicking the arrow keys:
To put a prefix in front of all axis numbers, or a suffix after:
Enter the prefix (i. e. “$”) or suffix (i. e. “%”) in the Format Axes dialog.
To rotate the numbering 90 degrees:
Set the number orientation In the All Ticks section in the Format Axes dialog.
To label axes with row titles instead of X values:
If you entered both X values and row titles on an XY data table, you can choose to label the axes with Row Titles instead of Decimal numbers via the Format setting in the Regularly spaced ticks section of the Format Axis dialog. If you do this, Prism will ignore the X values entirely, and use the row number (top row is 1) as the X values when plotting values.