
Enter row titles in a special column on the XY data table.
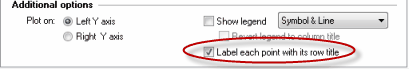
Click on the Format graph button on the Prism toolbar or double-click on any data point to open the Format Graph dialog. Check the "Label each point with its row title" box to include row titles on graph near each data point.
You can move each label by selecting it and dragging. Even if you move a label, however, Prism remembers its position relative to the data point -- so when you change your data, or the size and shape of your graph, the labels will adjust accordingly.
Click on any label on the graph and use the Text section of the Prism toolbar to change the size, font, and color of all the labels. You cannot adjust the font individually. All the row labels always share the same font, size and color.