1. Enter ROC data
From the Welcome or New table dialog, choose the Column tab. If you are not ready to enter your own data, choose the sample ROC data.
Enter diagnostic test results for controls into column A and patients in column B. Since the two groups are not paired in any way, the order in which you enter the data in the rows is arbitrary. The two groups may have different numbers of subjects.
Note that some other programs expect you to enter all the lab data into one column, and then differentiate patients from controls via a grouping variable entered into another column. Prism cannot analyze data entered this way.
2. Create the ROC curve
From the data table, click  on the toolbar, and then choose Receiver-operator characteristic curve from the list of one-way analyses.

In the ROC dialog, designate which columns have the control and patient results, and choose to see the results (sensitivity and 1-specificity) expressed as fractions or percentages. Don't forget to check the option to create a new graph
Note that Prism doesn't ask whether an increased or decrease test value is abnormal. Instead, you tell Prism which column of data is for controls and which is for patients, and it figures out automatically whether the patients tend to have higher or lower test results.
3. View the graph
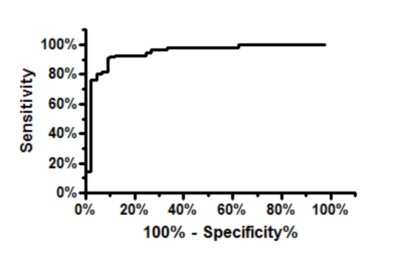
How to put several ROC curves on one graph
Each ROC analysis creates one ROC curve and graph. The XY points that define the graph are on a results page called "ROC curve". You can plot multiple ROC curves on one graph if you want to. The easiest way to do so is to go to a graph of one ROC curve, and drag the "ROC curve" results table from another one onto the graph. You can also change which data sets are plotted using the middle tab of the Format Graph dialog. The trick is realizing that the ROC curve is simply a data set created by an analysis, and it can be added to any graph.