The R2 quantifies how well a model fits the data. When you compare models, the one with more parameters can bend and twist more to come nearer the points, and so almost always has a higher R2. This is a bit misleading.
The adjusted R2 accounts for the number of parameters fit by the regression, and so can be compared between models with different numbers of parameters. The equations for the regular and adjusted R2 are compared here (SSresiduals is the sum-of-squares of the discrepancy between the Y value of the curve and the data; SStotal is the sum-of-squares of the differences between the overall Y mean and each Y value; n is the number of data points, and K is the number of parameters fit):
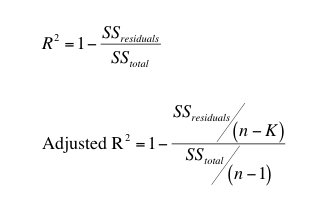
The adjusted R2 is smaller than the ordinary R2 whenever the number of parameters (K) is greater than 1.
Using the adjusted R2 to compare the fits of alternative models is better than using R2 (which should never be used) but not as good as using the extra sum-of-squares F test or the AICc methods built into Prism.