Q&A about R2
What does R2 quantify
•The value R2 quantifies goodness of fit. It compares the fit of your model to the fit of a horizontal line through the mean of all Y values.
•You can think of R2 as the fraction of the total variance of Y that is explained by the model (equation). With experimental data (and a sensible model) you will always obtain results between 0.0 and 1.0.
•Another way to think about R2 is the square of the correlation coefficient between the actual and predicted Y values.
What is the range of values R2 can have?
The simple answer is that R2 is usually a fraction between 0.0 and 1.0, and has no units. But there are special cases:
•R2 equals 1.00 when the curve goes through every point. But if you have replicate Y values at the same X value, it is impossible for the curve to go through every point, so R2 has to be less than 1.00.
•When R2 equals 0.0, the best-fit curve fits the data no better than a horizontal line going through the mean of all Y values. In this case, knowing X does not help you predict Y.
•When you choose a really inappropriate model or impose silly constraints (usually by mistake) the best-fit curve will fit worse than an horizontal line. In this case R2 will be negative. Yes that seems odd, but R2 is not really the square of anything and it is possible. Details at the bottom of this page.
•You may see references to R2 possibly having a value greater than 1.0. This can only happen when an invalid equation is used so the result is simply wrong.
r2 or R2?
By tradition, statisticians use uppercase (R2) for the results of nonlinear and multiple regression and lowercase (r2) for the results of linear regression, but this is a distinction without a difference.
Why do some suggest that R2 not be reported with nonlinear regression?
Minitab does not report R2 with nonlinear regression because they think it is too misleading. Kvalseth(1) also cautions about its use. The problems include:
•In linear regression, R2 compares the fits of the best fit regression line with a horizontal line (forcing the slope to be 0.0). The horizontal line is the simplest case of a regression line, so this makes sense. With many models used in nonlinear regression, the horizontal line can't be generated at all from the model. So comparing the fits of the chosen model with the fit of a horizontal line doesn't quite make mathematical sense. For this reason, SAS callls the value "Pseudo R2".
•It is tempting to use R2 to compare fits of alternative models. You shouldn't do this. The adjusted R2 is better for that purpose, but not ideal. Prism offers two better ways to compare fits of alternative models. Model selection has to assess the tradeoff -- more complicated models usually fit better but they have more parameters. Both methods Prism offers assess this tradeoff. R2 does not. R2 almost always gets larger with a more complicated model, even if the model is less likely to be correct. Don't base model selection on R2.
•Two models with the same number of parameters can fit the data quite differently with the AICc method telling you that one of those models is much more likely to be true. But the R2 values may only vary in the third or fourth digit after the decimal point.
•A high R2 tells you that the curve came very close to the points. That doesn't mean the fit is "good" in other ways. The best-fit values of the parameters may have values that make no sense (for example, negative rate constants) or the confidence intervals may be very wide. The fit may be ambiguous. You need to look at all the results to evaluate a fit, not just the R2.
Why does Prism report the R2 of nonlinear regression?
Prism computes and reports R2 by default. You can turn off reporting of R2 in the Diagnostics tab of the nonlinear regression dialog and set that preference as a default for future fits.
Many people find R2 useful in this way: When you run a series of experiments, you want to make sure that today's experiment is consistent with other runs of the experiment. For example, if you always get R2 between 0.90 and 0.95 but today you got R2=0.75, then you should be suspicious and look carefully to see if something went wrong with the methods or reagents used in that particular experiment. And if a new employee brings you results showing R2 of 0.99 using that same system, you should look carefully at how many"outliers" were removed, and whether some data were made up.
I think that is really the only way in which R2 is useful, but it can be quite useful for this purpose.
How R2 is calculated -- unweighted fits
R2 is computed from the sum of the squares of the distances of the points from the best-fit curve determined by nonlinear regression. This sum-of-squares value is called SSreg, which is in the units of the Y-axis squared. To turn R2 into a fraction, the results are normalized to the sum of the square of the distances of the points from a horizontal line through the mean of all Y values. This value is called SStot. If the curve fits the data well, SSres will be much smaller than SStot.
The figure below illustrates the calculation of R2. Both panels show the same data and best-fit curve. The left panel also shows a horizontal line at the mean of all Y values, and vertical lines showing how far each point is from the mean of all Y values. The sum of the square of these distances (SStot) equals 62735. The right panel shows the vertical distance of each point from the best-fit curve. The sum of squares of these distances (SSres) equals 4165.
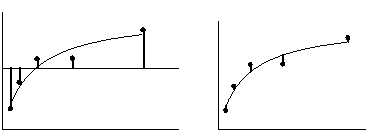
R2 is calculated using this equation:
R2 = 1.0 - (SSresiduals/SStotal) =1.0-4165/62735= 0.9336
This is method 1 from Kvalseth(1).
If you share parameters (perform global nonlinear regression) SSResiduals in the equation above is the Sum of Squares reported by Prism in the Global result column for the model with shared parameters being fitted, and SSTotal is the Sum of Squares of each Y value (from each data set) around the mean of ALL Y values (from all data sets).
How R2 is calculated -- weighted fits
There does not seem to be an established method for computing the R2 of a weighted nonlinear fit. Prism (since 6.00) calculates as detailed below. But note that earlier versions of Prism computed the R2 of weighted fits differently.
1.Fit the model using relative (1/Y2) or Poisson (1/Y) or general (1/XK)weighting to compute the weighted sum-of-squares (wSSmodel). This is the weighted sum-of-squares of the residuals from your model.
2.Remember the weight each point received.
3.Fit the data to a horizontal line model (Y=Mean + 0*X) using the same weights for each point as used in step 1. This is the weighted sum-of-squares of the residuals from a horizontal line (wSShorizontal).
The weighted R2 is:
1.0 - (wSSmodel/wSShorizontal)
Note that weights are only computed when fitting the model. Prism does not compute weights for the fit of the horizontal line but rather uses exactly the same weights as were used to fit the model. This ensures that the sum of the weights is identical in both fits.
For more detail, Prism uses equation 4 in Willett and Singer (2).
How can R2 be negative?
How can something squared be negative? Well, R2 is not really the square of anything. It is computed by subtracting two values. If SSres is larger than SStot, R2 will be negative (see equation above).
How can this happen? SSres is the sum of the squares of the vertical distances of the points from the best-fit curve (or line). SStot is the sum of the squares of the vertical distances of the points from a horizontal line drawn at the mean Y value. SSres will exceed SStot when the best-fit line or curve fits the data even worse than does a horizontal line.
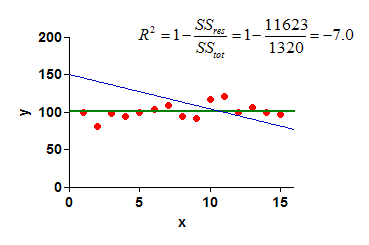
R2 will be negative when the best-fit line or curve does an awful job of fitting the data. This can only happen when you fit a poorly chosen model (perhaps by mistake), or you apply constraints to the model that don't make any sense (perhaps you entered a positive number when you intended to enter a negative number). For example, if you constrain the Hill slope of a dose-response curve to be greater than 1.0, but the curve actually goes downhill (so the Hill slope is negative), you might end up with a negative R2 value and nonsense values for the parameters.
Below is a simple example. The blue line is the fit of a straight line constrained to intercept the Y axis at Y=150 when X=0. SSres is the sum of the squares of the distances of the red points from this blue line. SStot is the sum of the squares of the distances of the red points from the green horizontal line. Since Sres is much larger than SStot, the R2 (for the fit of the blue line) is negative.
If R2 is negative, check that you picked an appropriate model, and set any constraints correctly.
1.Kvalseth, T.O. (1985) Cautionary Note about R2. American Statistician, 39, 279-285.
2.Willett, J.B., and Singer, J.D. (1988). Another Cautionary Note about R2 : Its Use in Weighted Least-Squares Regression Analysis. The American Statistician 42: 236.