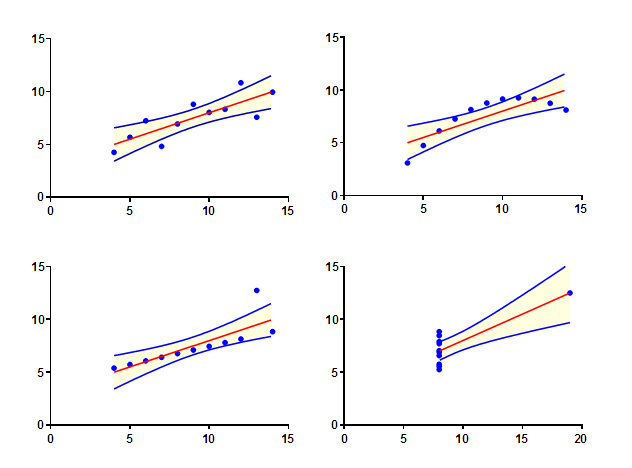
The four graphs below were created by Anscombe (1) to demonstrate the importance of looking at your data.The four data sets, the Anscome's quartet, all have 11 points. You can see at a glance that the data are very different. Surprisingly, the analyses of these four data sets are identical in many ways. When analyzed by linear regression, all these values are identical for all four graphs:
•The mean values of X and Y
•The slopes and intercepts
• r2
•The standard errors and confidence intervals of the slope and intercept
•The standard deviation of the residuals (sy.x)
•The F ratio and P value when testing the null hypothesis that the slope is really 0.0 (horizontal).
•The covariance between slope and intercept (computed by Prism's nonlinear regression analysis)
Differences seen in linear regression are:
•The confidence bands, shown in yellow below, are identical for three of the four graphs, but different for the fourth (which has different X values)
•The results of a runs test for linearity
•Normality tests of residuals
1. F.J. Anscombe, Graphs in Statistical Analysis, American Statistician, 27 (February 1973), 17-21.