The importance of constraints
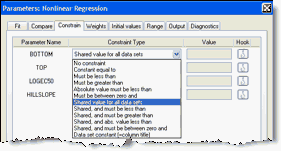
Prism lets you constrain each parameter to a constant value, constrain to a range of values, share among data sets (global fit), or define a parameter to be a column constant. This is an important decision, and will influence the results.
Constrain to a constant value
You won't always want to fit all the parameters in a model. Instead, you can fix one or more parameters to constant values. For example, if you have normalized a dose-response curve to run from 0 to 100, constrain Top to equal 100 and Bottom to 0.0. Similarly, if you have subtracted a baseline so you know that the exponential decay curve has to plateau at Y=0.0, you can constrain the Bottom parameter to equal 0.0.
Deciding to constrain a parameter to a constant value can make a huge difference in the results. Remember Prism has no common sense. It doesn't know if a curve has to plateau at zero unless you tell it.
Constrain to a range of values
Constrain to a range of values to prevent Prism from letting parameters take on impossible values. For example, you should constrain rate constants to only have values greater than 0.0, and fractions (say the fraction of binding sites that are high affinity) that have a value between 0.0 and 1.0. Setting this kind of constraint can have four outcomes:
•The constraint is irrelevant, as the parameter never would have taken on a value in the forbidden range.
•The constraint helped speed up the fit. Nonlinear regression works by iteratively changing the values of the parameters. With some complicated fits, the nonlinear regression process can 'get confused' and end up spending time exploring parameter values that make no sense. Constraining the values of one or more parameters can prevent the nonlinear regression process from being led astray. With huge numbers of data points, you might see a noticeable speeding up of the fitting process.
•The constraint helped nonlinear regression choose from several local minima. Nonlinear regression works by changing parameter values step by step until no small change affects the sum-of-squares (which quantifies goodness-of-fit). With some models, there can be two sets of parameter values that lead to local minima in sum-of-squares. Applying a constraint can ensure that nonlinear regression finds the minimum with scientifically relevant values, and ignores another minimum that fits the curve well but using parameter values that make no scientific sense (i.e. negative concentrations).
•The constraint prevents nonlinear regression from finding a minimum sum-of-squares. Instead, the best the program can do (while obeying the constraint) is set the parameter to the limit of the constrained range. Prism then reports that the fit 'hit constraint'.
In the first case, the constraint is harmless but useless.
In the next two cases, the constraint helps the nonlinear regression reach sensible results. Essentially, the constraint can give the nonlinear regression process some scientific judgment about which parameter values are simply impossible. These cases are really what constraints are for.
The last case, when the fit ends with a parameter set to one end of its constraint, it is tricky to interpret the results.
Constraints on constraints
Constraints can be for one parameter (Kfast must be greater than zero) or for the relationship between two parameters (Kfast must be greater than Kslow). But note that you cannot invoke a constraint between two parameters if both parameters also are themselves constrained. In a two phase exponential equation, you may want to constrain both parameters to be greater than zero, and also define one rate constant to be larger than the other (Kfast > Kslow). Prism won't let you do that. What you have to do is define one constraint that Kfast is greater than zero, and another that Kfast is greater than Kslow. But don't put in the constraint that Kslow is greater than zero. That is implied by being larger than Kfast.
Sharing parameters among data sets. Global nonlinear regression.
If you are fitting a family of curves, rather than just one, you can choose to share some parameters between data sets. For each shared parameter, Prism finds one (global) best-fit value that applies to all the data sets. For each non-shared parameter, the program finds a separate (local) best-fit value for each data set. Global fitting is a very useful tool in two situations:
•The parameter(s) you care about are determined from the relationship between several data sets. Learn more.
•Each dataset is incomplete, but the entire family of datasets defines the parameters. See example.
Data set constant
When you fit a family of curves at once, you can set one of the parameters to be a data set constant. Prism offers two data set constants.
Column title. The value comes from the column title, which can be different for every data set. This parameter becomes almost a second independent variable. It has a constant value within any one data set, but a different value for each data set. For example, when fitting a family of enzyme progress curves in the presence of various concentrations of inhibitor, the inhibitor concentration can be entered into the column title of the data table. View an example.
Mean X. The value is the mean of all the X values for which there are Y values in that data set. This is used in centered polynomial regression.
Different constants for different data sets
When you use the Constrain tab to set a parameter to a constant value, you do so for all data sets. It is not possible to enter a different constant value for each data set (unless you use the column title as the constant value as described in the previous section. If you want a parameter to have a different constant value (not the column title) for each data set, you'll need to write a user defined equation, and use special notation to assign a different value for each data set. You'll need to hard code the constants within the user-defined equation, and cannot choose them in the nonlinear regression parameters dialog. For example:
<A>Bottom=4.5
<B>Bottom=34.5
<C>Bottom=45.6
Y=Bottom + span*(1-exp(-1*K*X))
In this example, the parameter Bottom is set to 4.5 when fitting data set A, to 34.5 when fitting data set B, and to 45.6 when fitting data set C.