1.Open analysis parameters dialog
This example continues from the previous one. Click the analysis parameter button again.
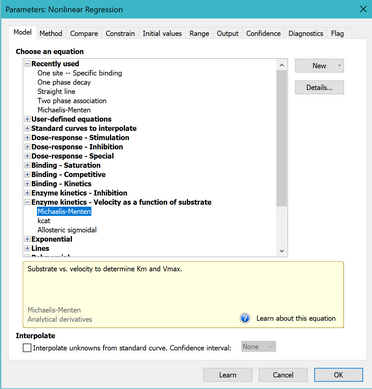
2. Choose the first model
On the Fit tab, choose (or make sure you still have chosen) the Michaelis-Menten equation.
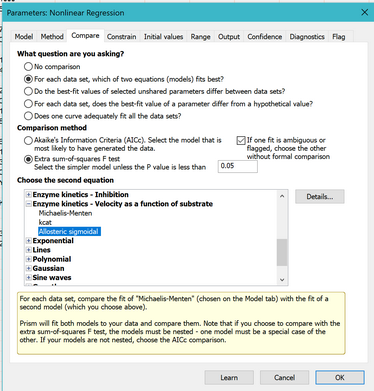
3. Choose the other model
Go to the Compare tab.
Choose: For each data set, which of two equations (models) fits best?
There are two ways to compare models. For this example, choose the extra sum-of-squares F test.
For the second equation, choose "Allosteric sigmoidal" from the Enzyme kinetics section.
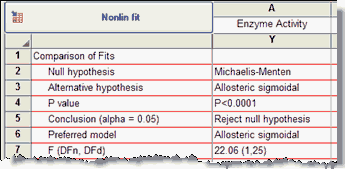
4. View the results of the model comparison
The top part of the results summarizes the comparison. The P value is low, suggesting that the simpler (Michaelis-Menten) model is too simple and should be rejected. The allosteric model fits significantly better.
5. View the numerical results of the fit to the allosteric model
Scroll down to the best-fit parameter values for the allosteric model.
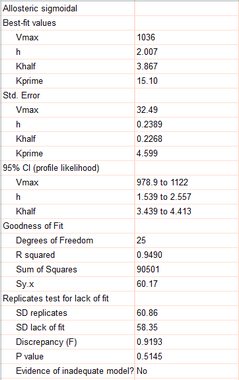
The P value of the replicates test is high, which means the scatter of points around the curve is consistent with variability of replicates from each other.
The parameter H equals 2.0, with a 95% confidence interval ranging from 1.5 to 2.5. A value of 2.0 suggests that this enzyme might be a dimer. When H equals 1.0, the allosteric model is identical to the Michaelis-Menten model.
Further interpretation must, of course, be in the context of what is known about this enzyme from prior work. Statistics is only part of analyzing scientific data.
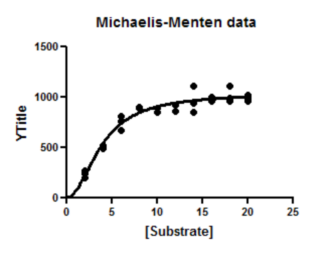
6. View the graph
Since the allosteric model fit significantly better, that is the model that Prism uses when it plots a curve on the graph. You can barely see that it has a sigmoidal shape. You can also see that you should collect more data with substrate concentrations between 0 and 5 to fully define this curve.