1. Create the data table
From the Welcome or New Table dialog, choose to create an XY data table, choose tutorial data sets, and select the sample data "Enzyme kinetics -- Michaelis-Menten" from the enzyme kinetics section.
2. Inspect the data
The sample data will be partly covered by a floating note explaining how to fit the data (for people who are not reading this help page). You can move the floating note out of the way, or minimize it.
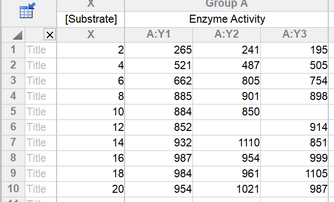
The data are in triplicate. Some values are missing, and Prism always handles these just fine.
3. View the graph
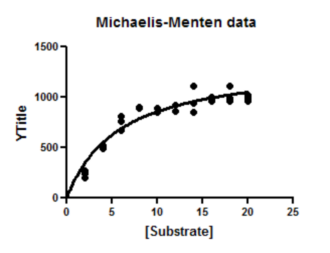
Prism automatically created a graph and gave it the same name as the data table. Click on the Michaelis-Menten graph in the graphs section.
Since this is the first time you are viewing the graph, Prism will pop up the Change Graph Type dialog. Select the third choice, to plot individual replicates rather than mean and error bars.
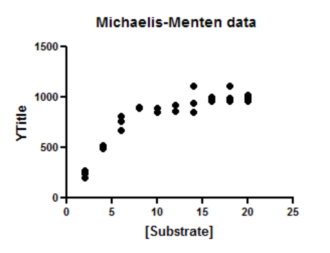
The graph Prism makes automatically is fairly complete. You can customize the symbols, colors, axis labels, position of legend, etc.
4. Choose nonlinear regression
Click the Analyze button and choose Nonlinear regression from the list of XY analyses.
Even faster, click the shortcut button for nonlinear regression.

5. Choose a model
On the Fit tab of the nonlinear regression dialog, open the equation folder, Enzyme Kinetics - Substrate vs. Velocity. Then choose the Michaelis-Menten equation.
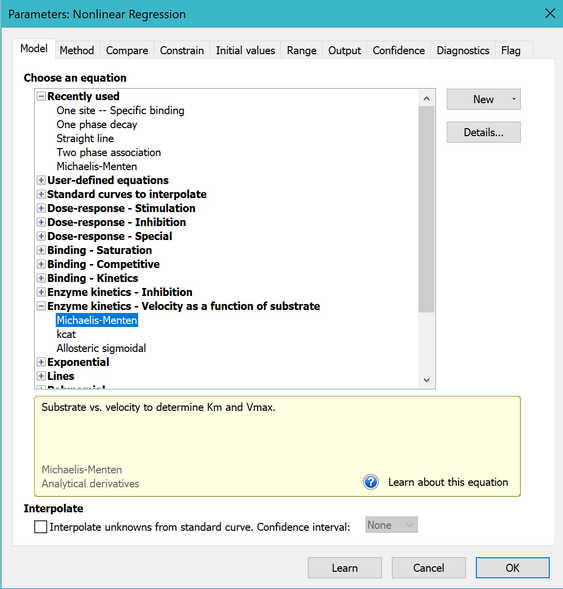
Learn more about the principles of enzyme kinetics and about fitting Michaelis-Menten curves.
For this example, leave all the other settings to their default values.
Click OK to see the curves superimposed on the graph.
6. Inspect the graph
7. Inspect the results
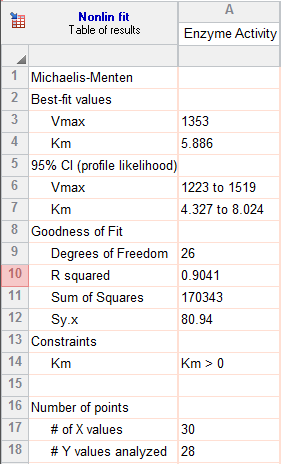
The goal of nonlinear regression is to find the best-fit values of the parameters. These are reported at the top of the table. You can't really interpret the best-fit values without knowing how precise they are, and this is reported both as standard errors and confidence intervals.
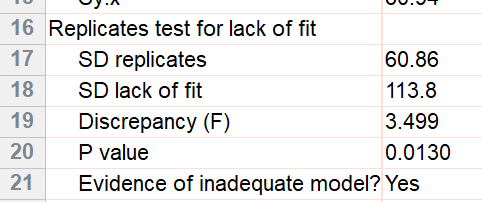
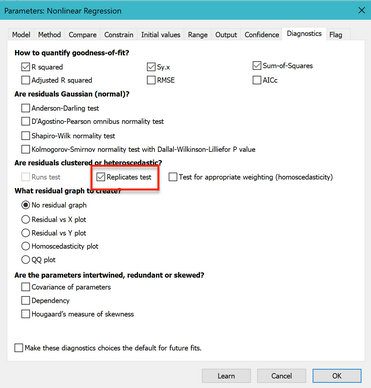
8. Go back and perform the replicates test
The replicates test assesses the adequacy of the fit by comparing the scatter among the triplicates with the scatter of points around the curve. It is not calculated by default, so the results do not appear in the results of step 7.
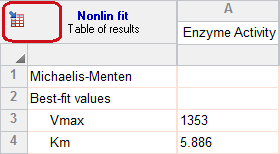
You don't have to do the fit over again. Instead click the button in the upper left corner of the results table to return to the nonlinear regression dialog.
Go to the Diagnostics tab, and check the option to perform the replicates test. Note that you can also check an option to make your settings here become the default for future fits.
The P value is small (0.013). This means that the scatter of the data from the curve is greater than you'd expect from the variation among triplicates. This suggests that you might want to consider fitting an alternative model, which we do in the next example.