This feature is useful if you analyze many sets of data (perhaps by running a script), and need a way to automatically flag poor fits that need to be inspected more carefully.
In the Flag tab, define the attributes that define poor fits you wish to flag. You can choose to flag a fit with any or all of the following attributes: low R2, too few data points, too high a dependency for any parameter, a failed normality test of residuals, a failed runs or residual test, or too many outliers.
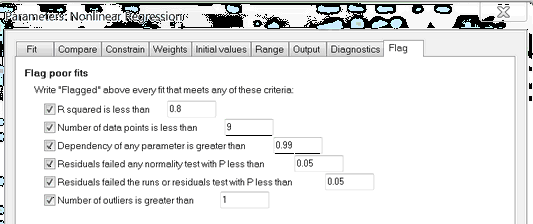
Some options may be gray if the corresponding option is gray in the Diagnostics tab. You can't flag, for example, fits with high dependency unless you chose the option to compute dependency.
What choices should you make? It depends on the kind of work your are doing. In some systems, you would only flag fits with R2 less than 0.50. In other systems, you expect tight data and so would flag any fit with R2 less than 0.90. Once you have fit a model to dozens or hundreds of similar data sets, you'll have a feel for what to expect, and when to flag dubious fits. Until then, don't flag fits.
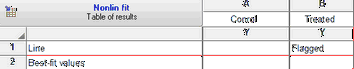
What happens if a fit is flagged? Not much! The word "Flagged" appears at the top of the fit as shown below. Use this as a cue to take a more careful look at this data set and its fit.
When you run a Monte-Carlo simulation, there is a new option to ignore (not tabulate) results from fits that are flagged.