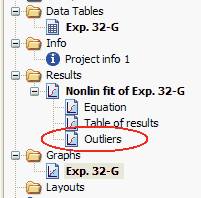
How to identify or eliminate outliers
Prism can identify outliers from the curve fit, and you can choose whether these should simply be plotted or also ignored by the curve fitting process. Choose in the Methods tab.
You can adjust the value of Q to redefine how aggressively Prism defines outliers.
How Prism plots outliers
If you choose to either count or eliminate outliers, Prism tabulates any outliers in a page of the results sheet called 'outliers' and plots them in red (unless data are plotted in red, in which case the outliers are blue).
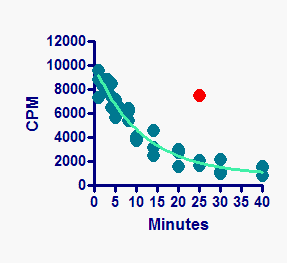
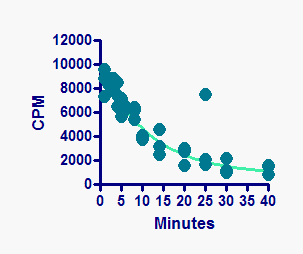
The example above shows a graph where each replicate is plotted individually. The example below shows a graph which plots mean and SD error bars. The error bars are computed from all the data, including any outliers. The outliers are then superimposed on the graph as well.
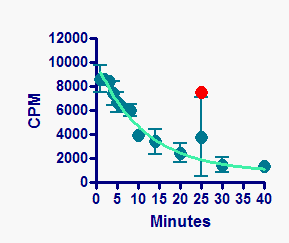
Note that Prism does not remove the outlier from the regular data set. When you plot mean and error bar, the outlier is included in the calculation. When you plot individual data points, the outlier is still plotted with the full dataset. Then Prism superimposes the outlier(s) as a separate dataset plotted in front.
Look back at the first example, showing each replicate. You can see that the curve goes over the data points. If you want the curve to go under the data points, click the Reverse/Flip/Rotate button.
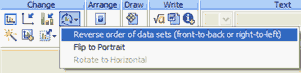
The results, above, are not exactly what you want. Indeed the relative front-to-back order of data and curve has reversed, so the curve is now behind the points. But the relative front-to-back order of the full dataset and the outlier dataset is also reversed, so the outlier is now behind the regular data point, so is invisible. This demonstrates that Prism does not really change the color of the data points of outliers. Rather, it plots the outliers twice -- once as part of the full data set and again as part of the outlier dataset superimposed on the graph. To get the effect you want here, go to the Data on Graph tab of the Format Graph dialog, and fine-tune the back-to-front order of data sets (with the outlier(s) and curve considered to be data sets).