Outliers
Use with caution
Automatic outlier removal is extremely useful, but can lead to invalid (and misleading) results in some situations, so should be used with caution. You can ask Prism to simply identify and count values it identifies as outliers. Or you can ask it to exclude identified outliers from the data set being fit.
Rout coefficient
If choose to exclude or identify outliers, set the ROUT coefficient Q to determine how aggressively Prism defines outliers.
We recommend using a value of 1%. Our simulations have shown that if all the scatter is Gaussian, Prism will falsely find one or more outliers in about 2-3% of experiments. If there really are outliers present in the data, Prism will detect them with a False Discovery Rate less than 1%. See reference 1.
If you set Q to a higher value, the threshold for defining outliers is less strict. This means that Prism will have more power to detect outliers, but also will falsely detect 'outliers' more often. If you set Q to a lower value, the threshold for defining outliers is stricter. This means that Prism will have a less power to detect real outliers, but also have a smaller chance of falsely defining a point to be an outlier.
If you set Q to 0, Prism will fit the data using ordinary nonlinear regression without outlier identification.
Create table of cleaned data
Check the option (introduced with Prism 8) to create a new analysis tab with a table of cleaned data (data without outliers). Prism does not automatically graph this table of cleaned data, but it is easy to do so (New..Graph of existing data).
Prism always creates an analysis tab table of outliers, and there is no option to not show this.
Fitting method
Prism offers four choices of fitting method:
Least-squares
This is standard nonlinear regression. Prism minimizes the sum-of-squares of the vertical distances between the data points and the curve, abbreviated least squares. This is the appropriate choice if you assume that the distribution of residuals (distances of the points from the curve) are Gaussian.
Robust regression
Robust regression is less affected by outliers, but it cannot generate confidence intervals for the parameters, so has limited usefulness. Its main use in Prism is as a first step in outlier detection. It is the baseline from which to determine if a residual is "too large" so the point should be declared an outlier. It is rarely helpful to perform robust regression on its own, but Prism offers you that choice if you want to.
Poisson regression
Choose Poisson regression when every Y value is the number of objects or events you counted. These must be the actual counts, not normalized in any way. If a machines says your sample had 98.5 radioactive decays per minute, but you asked the counter to count each sample for ten minutes, then it counted 985 radioactive decays. That is the value you should enter for Poisson regression. If the Y values are normalized counts, and are not actual counts, then you should not choose Poisson regression.
Don't fit
Nonlinear regression works iteratively, and begins with initial values for each parameter. Check "don't fit the curve" to see the curve generated by your initial values. If the curve is far from the data, go back to the initial parameters tab and enter better values for the initial values. Repeat until the curve is near the points. Then go back to the Methods tab and check "Fit the curve". This is often the best way to diagnose problems with nonlinear regression.
Convergence criteria
Nonlinear regression is an iterative process. It starts with initial values of the parameters, and then repeatedly changes those values to increase the goodness-of-fit. Regression stops when changing the values of the parameters makes a trivial change in the goodness of fit.
How strict?
Prism lets you define the convergence criteria in three ways.
•Quick. If you are fitting huge data sets, you can speed up the fit by using the 'quick' definition of convergence. With this choice, nonlinear regression is defined to converge when two iterations in a row change the sum-of-squares by less than 0.01%.
•Medium (default). Nonlinear regression is defined to converge when five iterations in a row change the sum-of-squares by less than 0.0001%.
•Strict. If you are having trouble getting a reasonable fit, you might want to try the stricter definition of convergence. With this choice, the nonlinear regression iterations don't stop until five iterations in a row change the sum-of-squares by less than 0.00000001%. It won't help very often, but might be worth a try. The only reason not to always use the strictest choice is that it takes longer for the calculations to complete. That won't matter with small data sets, but will matter with large data sets or when you run scripts to analyze many data tables.
Maximum number of iterations
While fitting a curve, Prism will stop after that many iterations. The default is 1000, and there is little reason to enter a different value. One reason would be if you are running a script to automatically analyze many data tables, each with many data points. The fits might be slow enough that it makes sense to lower the maximum number of iterations so Prism won't waste time trying to fit impossible data.
Weighting method
It is often useful to differentially weight the data points. Learn why.
Prism offers seven choices on the Method tab of nonlinear regression:
No weighting. Regression is most often done by minimizing the sum-of-squares of the vertical distances of the data from the line or curve. Points further from the curve contribute more to the sum-of-squares. Points close to the curve contribute little. This makes sense, when you expect experimental scatter to be the same, on average, in all parts of the curve.
Weight by 1/Y^2. In many experimental situations, you expect the average distance (or rather the average absolute value of the distance) of the points from the curve to be higher when Y is higher. The points with the larger scatter will have much larger sum-of-squares and thus dominate the calculations. If you expect the relative distance (residual divided by the height of the curve) to be consistent, then you should weight by 1/Y2.
Weight by 1/Y. This choice is useful when the scatter follows a Poisson distribution -- when Y represents the number of objects in a defined space or the number of events in a defined interval.
Weight by 1/YK. Also called "General weighting". Read more.
Weight by 1/X or 1/X2 .These choices are used rarely. Only choose these weighting schemes when it is the standard in your field, such as a linear fit of a bioassay.
Weight by 1/SD2. If you enter replicate Y values at each X (say triplicates), it is tempting to weight points by the scatter of the replicates, giving a point less weight when the triplicates are far apart so the standard deviation (SD) is high. But unless you have lots of replicates, this doesn't help much. The triplicates constituting one mean could be far apart by chance, yet that mean may be as accurate as the others. Weighting needs to be based on systematic changes in scatter. The choice to weight by 1/SD2 is most useful when you want to use a weighting scheme not available in Prism. In this case, enter data as mean and SD, but enter as "SD" weighting values that you computed elsewhere for that point. In other words, the values you enter in the SD subcolumn are not actually standard deviations, but are weighting factors computed elsewhere.
Notes on weighting
•If you have normalized your data, weighting rarely makes sense.
•Simulations can show you how much difference it makes if you choose the wrong weighting scheme.
•If you choose unequal weighting, Prism takes this into account when plotting residuals.
•Prism accounts for weighting when it computes R2.
•Learn about the math of weighting and how Prism does the weighting.
•If you choose robust regression in the Fitting Method section, then certain choices in the Weighting method section will not be available. Note that your choice of weighting will have an impact on the residuals Prism computes and graphs and on how it identifies outliers. Options for outlier detection and handling can also be found on the Method tab, while options for plotting graphs of residuals can be found on the Diagnostics tab of nonlinear regression.
•If you ask Prism to remove outliers, the weighting choices don't affect the first step (robust regression). Then outliers are identified by looking at the size of the weighted residuals. Finally, the cleaned data (without outliers) are fit with weighted regression.
Replicates
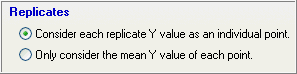
Choose whether to fit all the data (individual replicates if you entered them, or accounting for SD or SEM and n if you entered the data that way) or to just fit the means.
If you fit only the means, Prism "sees" fewer data points, so the confidence intervals on the parameters tend to be wider, and there is less power to compare alternative models. For these reasons,when possible you should choose to let the regression see each replicate as a point and not see means only.
The issue comes down to one of independence. An important assumption of regression is that the residuals from all data points are independent. Here is an example where the replicates are not independent, so you would want to fit only the means: You performed a dose-response experiment, using a different animal at each dose with triplicate measurements. The three measurements are not independent because if one animal happens to respond more than the others, all the replicates are likely to have a high value. Since the replicates are not independent, you should fit the means and not the individual replicates.
If you entered the data as mean, n, and SD or SEM Prism gives you the choice of fitting just the means, or accounting for SD and n. If you make that second choice Prism will compute exactly the same results from least-squares regression as you would have gotten had you entered raw data.
Reference
1.Motulsky HM and Brown RE, Detecting outliers when fitting data with nonlinear regression – a new method based on robust nonlinear regression and the false discovery rate, BMC Bioinformatics 2006, 7:123..