What is dependency?
When the model has two or more parameters, as is almost always the case, the parameters can be intertwined.
What does it mean for parameters to be intertwined? After fitting a model, change the value of one parameter but leave the others alone. The curve moves away from the points. Now, try to bring the curve back so it is close to the points by changing the other parameter(s). If you can bring the curve closer to the points, the parameters are intertwined. If you can bring the curve back to its original position, then the parameters are redundant.
Prism can quantify the relationships between parameters by reporting the correlation matrix or reporting dependency.
Interpreting dependency
You can interpret dependency without knowing much about how it is calculated. Read on if you are interesting in knowing how the value is computed.
Example of dependency calculations
This example is an exponential decay (taken from pages 128-130 of the MLAB Applications Manual, www.civilized.com.
Time Signal 1.0 39.814 2.0 32.269 3.0 29.431 4.0 27.481 5.0 26.086 6.0 25.757 7.0 24.932 8.0 23.928 9.0 22.415 10.0 22.548 11.0 21.900 12.0 20.527 13.0 20.695 14.0 20.105 15.0 19.516 16.0 19.640 17.0 19.346 18.0 18.927 19.0 18.857 20.0 17.652 |
|
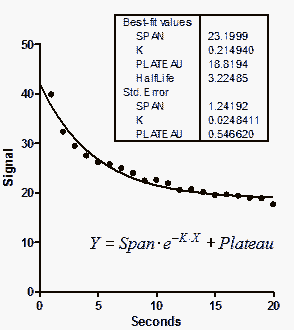
We will focus on the rate constant, K. The best fit value is 0.2149 sec-1, which corresponds to a half-life of 3.225 seconds. Its SE is 0.0248 sec-1, which corresponds to a 95% confidence interval of 0.1625 to 0.2674 sec-1.
It is clear that the three parameters are not entirely independent. If you forced K to have a higher value (faster decay), the curve would get further from the points. But you could compensate a bit by starting the curve at a higher value and ending at a lower one (increase Span and decrease Plateau). The SE values of the parameters depend on one another.
Fix Span and Plateau to their best fit values, and ask Prism to fit only the rate constant K. This will not change the best fit value, of course, since we fixed Span and Plateau to their best-fit values. But the SE of K is lower now, equal to 0.008605. This makes sense. Changing the value of K has a bigger impact on goodness-of-fit (sum-of-squares) when you fix the Span and Plateau than it does when you allow the values of Span and Plateau to also change to compensate for the change in K.
The lower value of the SE of K when you fix the other parameters tells you that the uncertainty in K is dependent on the other parameters. We want to quantify this by computing the dependency.
Before we can compare the two SE values, we have to correct for a minor problem. When computing the SE, the program divides by the square root of the number of degrees of freedom (df). For each fit, df equals the number of data points minus the number of parameters fit by the regression. For the full fit, df therefore equals 20 (number of data points) minus 3 (number of parameters) or 17. When we held the values of Plateau and Span constant, there was only one parameter, so df=19. Because the df are not equal, the two SE values are not quite comparable. The SE when other parameters were fixed is artificially low. This is easy to fix. Multiply the SE reported when two of the parameters were constrained by the square root of 19/17. This corrected SE equals 0.00910.
Now we can compute the dependency. It equals 1.0 minus the square of the ratio of the two (corrected) SE values. So the dependency for this example equals 1.0-(0.0091/0.0248)2, or 0.866. Essentially, this means that 86.6% of the variance in K is due to is interaction with other parameters.
Each parameter has a distinct dependency (unless there are only two parameters). The dependency of Span is 0.613 and the dependency of Plateau is 0.813.
The origin of the idea of dependency
There appears to be no paper to cite regarding the first use of dependency. The idea of dependency apparently was developed by Dick Shrager at the NIH, and then enhanced by Gary Knott. MLAB was the first software to compute dependency, and it is explained well in the MLAB manual. GraphPad Prism simply implements the method as it is explained there. (I learned this history in an email from Gary Knott in 2007). Here is an early paper that discusses the basic ideas of dependency, but it is defined differently (ranging from 1 to infinity, rather than 0 to 1, and the math is not fully explained.