Introduction
Data follow a Gaussian distribution when scatter is caused by the sum of many independent and equally weighted factors.
A frequency distribution (histogram) created from Gaussian data will look like a bell-shaped Gaussian distribution.
Step-by-step
The data you fit must be in the form of a frequency distribution on an XY table. The X values are the bin center and the Y values are the number of observations.
If you start with a column of data, and use Prism to create the frequency distribution, make sure that you set the graph type to "XY graph", with either points or histogram spikes. This ensures that Prism creates an XY results table with the bin centers entered as X values. If you pick a bar graph instead, Prism creates a column results table, creating row labels from the bin centers. This kind of table cannot be fit by nonlinear regression, as it has no X values.
Starting from the frequency distribution table, click Analyze, choose Nonlinear regression from the list of XY analyses, and then choose the "Gaussian" equation from the "Gaussian" family of equations.
Model (Gaussian distribution)
Y=Amplitude*exp(-0.5*((X-Mean)/SD)^2)
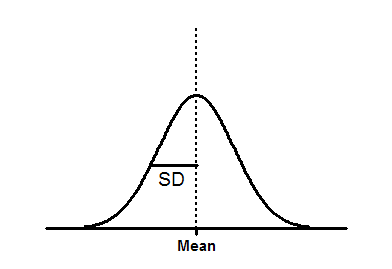
Amplitude is the height of the center of the distribution in Y units.
Mean is the X value at the center of the distribution.
SD is a measure of the width of the distribution, in the same units as X.
The mean and SD will not be identical to the mean and SD computed directly from the raw data. There are two reasons for the discrepancy. The first is that creating the frequency distribution requires a fairly arbitrary decision about bin width, and that will influence the best-fit values of Mean and SD. The second reason is that the nonlinear regression assumes that the residuals (the distances of the points from the curve) follow a Gaussian distribution. This assumption won't be exactly true in a frequency distribution.
Model (sum of two Gaussian distributions)
If your data are a mixture of values sampled from two Gaussian distributions, fit the frequency distribution to a model of the sum of two Gaussian distributions.
One=Amplitude1*exp(-0.5*((X-Mean1)/SD1)^2)
Two=Amplitude2*exp(-0.5*((X-Mean2)/SD2)^2)
Y= One + Two
Amplitude1 and Amplitude2 are the heights of the center of the distribution in Y units.
Mean1 and Mean2 are the X values at the center of the two distributions.
SD1 and SD2 are measures of the widths of the distributions, in the same units as X.
Prism is not very smart about assigning initial values to the parameters. If you have trouble getting this model to fit, try fussing with the initial parameter values.
Area under a Gaussian distribution
The area under a Gaussian distribution equals Amplitude*SD/0.3989. That constant equals the reciprocal of the square root of two pi.