Note: Versions of Prism up to 7.00 and 7.0a used a different and nonstandard form of this equation which we called log(Gaussian).
Introduction
Data follow a Gaussian distribution when scatter is caused by the sum of many independent and equally weighted factors.
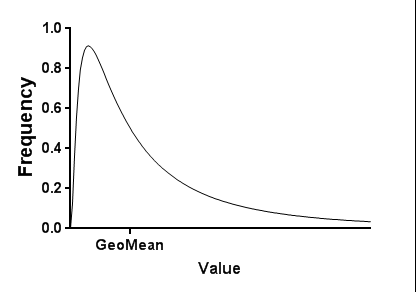
When scatter is caused by the product of many independent and equally weighted factors, data follow a lognormal distribution. When plotted on a linear X axis, this is skewed to the right (see below). When plotted on a logarithmic X axis, it looks like a bell-shaped Gaussian distribution.
Step-by-step
The data must be in the form of a frequency distribution on an XY table. The X values are the bin center and the Y values are the number of observations.
If you start with a column of data, and use Prism to create the frequency distribution, make sure that you set the graph type to "XY graph", with either points or histogram spikes. This ensures that Prism creates an XY results table with the bin centers entered as X values. If you pick a bar graph instead, Prism creates a column results table, creating row labels from the bin centers. This kind of table cannot be fit by nonlinear regression, as it has no X values.
Starting from the frequency distribution table, click Analyze, choose Nonlinear regression from the list of XY analyses, and then choose the "lognormal" equation from the "Gaussian" family of equations.
Model
Y=(A/X)*exp(-0.5*(ln(X/GeoMean)/ln(GeoSD))^2)
GeoMean is the geometric mean in the units of the data.
GeoSD is the geometric standard deviation factor. It is a unitless ratio.
A is related to the amplitude and area of the distribution.
Amplitude = A / (GeoMean / exp(0.5*ln(GeoSD)^2))
Area = A * sqrt(2 * pi) * ln(GeoSD)
A more standard form of the model (from Wikipedia or MathWorld) is:
Y= (1/(X*S*sqrt(2*pi)))*exp(-0.5*(ln(X)-M)^2/(S^2))
This standard form of the equation doesn't have the A parameter because the area under the curve, using the equation above, is always 1.0. S in this model equals ln(GeoSD) and M equals ln(GeoMean).