Relative weighting (weighting by 1/Y2)
In many experimental situations you expect the average distance (or rather the average absolute value of the distance) of the points from the curve to be higher when Y is higher. Another way to say this is that you expect the standard deviation of the residuals (distance of points from the curve) to get larger when Y is higher -- for the standard deviation to be proportional to the value of Y. Yet another way to say this is that you expect the coefficient of variation to be constant, but for the SD to not be constant.
If the SD of residuals is related to the value of Y, then the points with larger Y values will tend to be further from the curve (have larger residuals). These points will therefore contribute more to the sum-of-squares, and thus dominate the calculations.
The solution is not to minimize the sum-of-squares, but rather to minimize the weighted sum-of-squares. In other words, minimize the relative distances of the Y values of the data (Ydata) from the Y values of the curve (Ycurve). When you choose relative weighting, nonlinear regression minimizes this quantity:
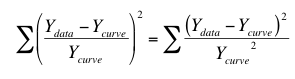
The left side is easiest to understand. For each point, compute how far it is (in the Y direction) from the curve, divide that value by the Y value of the curve, and square that ratio. Add up that squared ratio for all points. The right side is equivalent. It squares the numerator and denominator separately, and then computes the ratio of those two squared values. This is the way most mathematical statisticians think about weighting, so relative weighting is also called weighting by Y2.
Poisson weighting
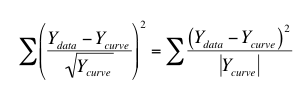
Weighting by 1/Y is a compromise between minimizing the actual distance squared and minimizing the relative distance squared. One situation where 1/Y weighting is appropriate is when the Y values follow a Poisson distribution. This would be the case when Y values are radioactive counts and most of the scatter is due to counting error. With the Poisson distribution, the standard error of a value equals the square root of that value. Therefore you divide the distance between the data and the curve by the square root of the value, and then square that result. The equation below shows the quantity that Prism minimizes, and shows why it is called weighting by 1/Y (but Prism actually weights by the absolute value of Y.)
General weighting
The first three equations below shows how absolute, Poisson and relative weighting are related. Note that taking anything to the zero power results in 1.0, so the denominator of equation on the left always equals 1.0.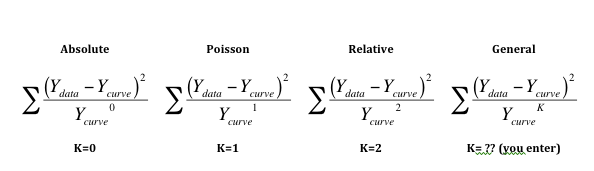
The equation on the right shows general weighting. You enter K so can customize the weighting scheme to fit your data. Generally this choice is used with values of K between 1.0 and 2.0. Reference 1 below uses this approach.
If you want to experimentally determine the best value of K, you can do so:
1.Collect data with lots (over a dozen; maybe several dozen) replicates at many points along the curve.
2.Plot the data the usual way to make sure the data seem correct.
3.Create a second graph that ignores the X values (time or concentration...). Instead, in this new graph, X is the logarithm of mean of the replicate Y values for each point on the first graph, and Y on this new graph is the logarithm of variance (square of the standard deviation) among the replicate values. You can use either natural logarithms or logarithms base 10. It doesn't matter, so long as both logarithms uses the same base.
4.Fit a straight line to this graph using linear regression. Since the assumption of a Gaussian variation around this line is dubious, use nonlinear regression and choose a robust fit.
5.The slope of this regression line is K. If K is close to 0.0, then the SD does not vary with Y so no weighting is needed. If K is close to 2.0, then the standard deviation is proportional to Y, and relative weighting is appropriate. If K is close to 1.0, choose Poisson weighting. If K has some other value, use general weighting and enter this value of K as a constant.
Note that if Ycurve is negative, Prism actually takes the the absolute value of Ycurve to the K power.
Rarely used weighting choices in Prism
The choices to weight by 1/X or 1/X2 weight the points at the left part of the graph more than points to the right. This is common in some fields when fitting straight lines to bioassay data.
Prism also offers the choice to weight by the reciprocal of the standard deviation squared. This option minimizes the following:
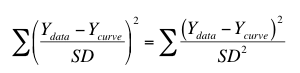
This method is most useful when you have formatted the data table for entry of SD values, but then entered values that you had calculated elsewhere based on understanding how the scatter (or errors) arise in your experimental system. The "SD" values you enter should be computed weighting factors, not the actual SD of the data.
If you enter the actual SD into the SD subcolumn, or enter replicate values so Prism computes the SD, then Prism will use these actual SD values as weighting factors. This is way less useful than it sounds. With small to moderate sample sizes, the SD will jump around a lot by chance, and it is not appropriate to use these random SD values for weighting. Weighting should be by predicted SD not actual SD (which is subject to random factors).
Of course, weighting by SD is impossible if any of the entered SD values are zero. It also is impossible if Prism is computing the SD from replicates and there is only one replicate, or if all replicates are identical (so their SD equals zero).
Prism doesn't use weighting on the first iteration
There is one situation where weighting by the predicted Y values of the curve causes problems - when the initial values are really bad. The initial curve can be quite far from the points, and in some cases can have Y=0 for some X values, which makes weighting by 1/Y or 1/Y2 impossible. To improve the fitting, even if the initial values generate a curve far from the data, Prism uses no weights for the first iteration. This first iteration brings the curve closer to the points. From then on, Prism uses the weighting function you specify. Essentially it uses the results of one iteration of unweighted fitting as the initial values for the weighted fit.
Reference
1. LM Lavasseur, H Faessel, HK SLocum, and WR Greco, Implications for Clinical Pharmacodynamic Studies of the Statistical Characterization, of an In Vitro Antiproliferation Assay, J. Pharmacokinetics and pharmacodynamics, 26: 717-733, 1998.