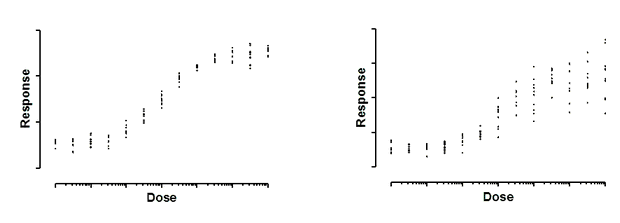
Both graphs above show dose-response curves, with response measured in ten replicate values at each response. In the left graph, the standard deviation of those replicates is consistent. It is about the same all the way along the curve. In the right graph, the standard deviation of the replicates is related to the value of Y. As the curve goes up, variation among replicates increases.
These data are simulated. In both cases, the scatter among replicates is sampled from a Gaussian distribution. In the graph on the left, the SD of that Gaussian distribution is the same for all doses. On the right, the SD is a constant fraction of the mean Y value. When a response is twice as high as another response, the standard deviation among replicates is also twice as large. In other words, the coefficient of variation (CV) is constant.
What happens if you fit a model to the data on the right without taking into account the fact that the scatter increases as Y increases? Consider two doses that give different responses that differ by a factor of two. The average distance of the replicates from the true curve will be twice as large for the higher response. Since regression minimizes the sum of the squares of those distances those points will be expected to contribute four times as much to the sum-of-squares as the points with the smaller average Y value. In other words, the set of replicates whose average Y value is twice that of another set will be given four times as much weight. This means, essentially, that the curve fitting procedure will work harder to bring the curve near these points, and relatively ignore the points with lower Y values. You'd need to have four times as many replicates in the lower set to equalize the contribution to the sum-of-squares.
The goal of weighting is for points anywhere on the curve to contribute equally to the sum-of-squares. Of course random factors will give some points more scatter than others. But the goal of weighting is to make those differences be entirely random, not related to the value of Y. The term weight is a bit misleading, since the goal is to remove that extra weight from the points with high Y values. The goal is really to unweight.
Prism offers six choices on the Method tab of nonlinear regression, and lets you test for appropriate weighting.