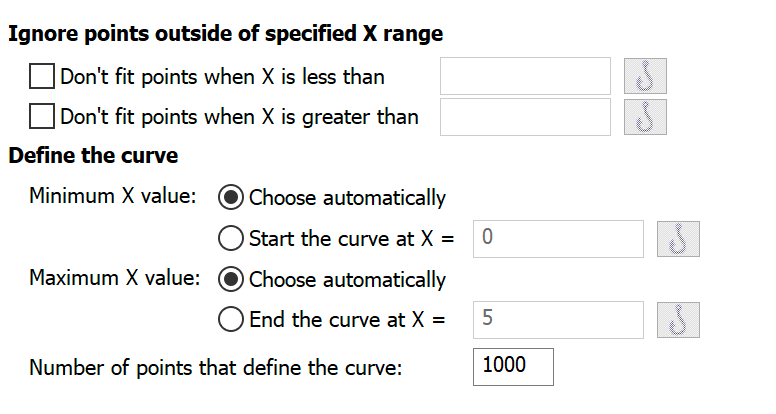
Ignore points outside of a specified X range
If you choose these options nonlinear regression will completely ignore all data where the X value is less than, or larger than, the thresholds you set. This could be useful if you collect data over time, and only want to fit data within a certain range of time points.
Define the curve
In addition to fitting the model to your data, Prism also superimposes the curve on your graph. Choose where the curves should begin and end, and how many equally spaced points define the curve.
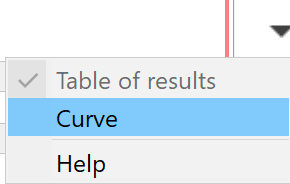
Table of XY coordinates
Prior to version 8, Prism gave you an option on this tab to show (or not show) a table of XY coordinates. Prism 8 does not give you this option here.
Instead, Prism 8 always creates this results tab, but it is hidden by default. Use the menu to the right of the analysis tabs to check the option to view this tab. This will let you see the XY coordinates of the points that define the curve, and also do further analyses with that table.