Reasons for all interpolated values to be blank
If the nonlinear regression procedure did not converge on a best-fit curve, then Prism will leave all interpolated values blank. It doesn't make sense to interpolate unless Prism finds a good curve.
Reasons for some interpolated values to be blank
When you ask Prism to interpolate X values from Y values you enter, it will leave the result blank when it is unable to find a result. This can happen when:
•The input value for Y falls out of the vertical range of the standard curve. This happens when you fit a sigmoidal log(dose) vs response curve. If you enter an unpaired Y value that is larger than the best-fit value of Top, or smaller than the best-fit value of Bottom, there simply is no corresponding X value, and Prism will simply leave that part of the Results sheet blank. Note that "top" and "bottom" apply to the best-fit values for those fitted parameters, not the maximum and minimum values of the input data. It simply is impossible to interpolate a X value if the Y value is too high, or too low, to be on the curve.
•The interpolated X value falls way outside the output range of X for the fitted curve. Prism will try to extrapolate a bit beyond the range of X values for which it calculates and draws the curve. But it won't extrapolate far from the ends of the curve. You can extend this range. From the Nonlinear regression Parameters dialog, choose the Range tab and enter a lower value for the minimum X and/or a higher value for the maximum X.
•You entered the unknowns in rows of the data table above (smaller row numbers) than the standard curve values. The unknowns must be entered in rows below the standards.
•You mistakenly entered the unknowns in the wrong units. The unknown values must be in the same units as the standards. If you enter unknown Y values and expect Prism to interpolate an X value, then the unknown Y values must be entered in the same units as the Y values for the standards.
Reasons for the confidence limits of interpolated value is blank
Prism will leave the confidence interval of the interpolated value blank in two situations:
• The fit is ambiguous.
• If you chose a robust fit.
In some cases, Prism will report confidence limits for some interpolated values, but not all of them.
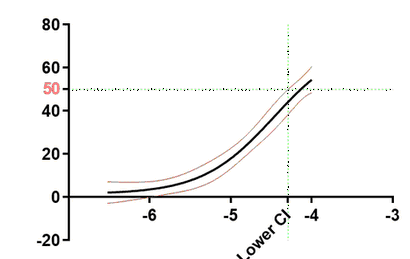
Prism can only report the confidence interval for an interpolated value when the curve is drawn far enough along the X axis. The graph below shows an example where Prism can report the lower confidence limit but not the upper one. The horizontal green line shows the interpolation. You asked Prism for the X value when Y=50. The interpolation works fine as does the lower confidence limit. But notice that the lower confidence band (in red) does not extend far enough to intersect the horizontal green line. That is why Prism can't report the upper confidence limit which would be the X coordinate where the lower confidence band of the curve intersects the horizontal line at Y=50. To fix this problem, go to the Range tab and extend the curve to larger values of X. In the example below, extending the range of the curve to -3 would solve the problem.
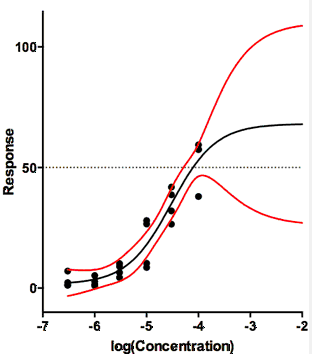
Reason why one confidence limit of an interpolated value is blank
In some cases, the bottom confidence band bends downwards, so the upper confidence limit of the interpolated value is simply undefined. The figure below shows one such example. It doesn't matter how far you extend the X axis, the upper confidence limit of the interpolated value is simply not defined by the data. The dotted horizontal line at Y=50 will never intersect the lower of the confidence bands. The only fix would be to collect data at higher X concentrations, or perhaps more precise Y values.