Consider a sample of data from a clinical trial shown below:
Enrolled |
Final date |
Elapsed time of observation (days) |
What happened |
Group |
|---|---|---|---|---|
07-Feb-2016 |
02-Mar-2020 |
1485 |
Died |
Treated |
19-May-2016 |
30-Nov-2016 |
195 |
Died |
Treated |
14-Nov-2016 |
03-Apr-2020 |
1236 |
Died |
Treated |
01-Dec-2016 |
04-Mar-2019 |
823 |
Died |
Control |
04-Mar-2017 |
04-May-2019 |
791 |
Died |
Control |
01-Apr-2017 |
09-Sep-2020 |
1257 |
Alive at end of study |
Treated |
01-Jun-2017 |
03-Jun-2019 |
732 |
Moved, off protocol |
Control |
03-Jul-2017 |
09-Sep-2020 |
1164 |
Alive at end of study |
Control |
03-Jan-2018 |
09-Sep-2020 |
980 |
Alive at end of study |
Control |
04-Mar-2018 |
05-Feb-2020 |
703 |
Died in car crash |
Treated |
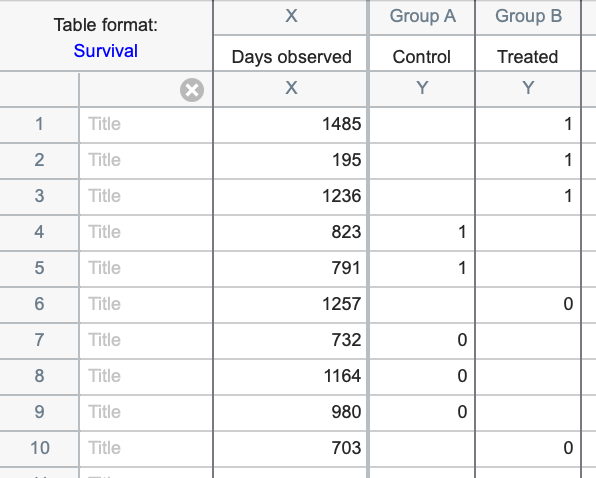
Here is what these data would look like when entered into Prism using total elapsed time in days until the event of interest (death in this case) for the X column:
Alternatively, the data could have been entered using the starting and ending dates for each observation as shown below:
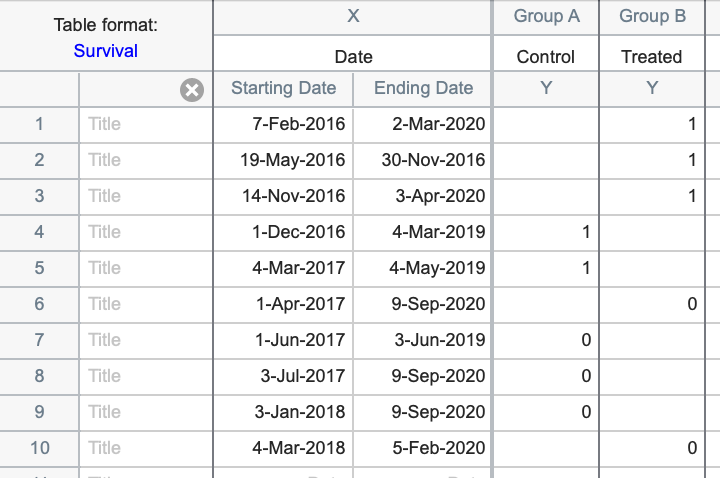
The survival table in Prism is unique in that it allows you to enter either total elapsed time of observation or to enter specific starting and ending dates for each individual observation. If you choose to enter starting and ending dates, Prism will calculate the number of whole days (or weeks or years depending on the range of the dates), and use these values as the survival time. Note that time of day is not used when entering starting and ending dates directly into Prism (and thus, fractional days are not considered when calculating survival time). If - instead of dates - you have specific starting and ending times or timestamps (for example 01-Jan-2021 10:00:00.000 am and 02-Jan-2021 11:00:00.000 pm), you can easily calculate elapsed survival times with fractional days using Excel. Simply enter these timestamps into two separate cells, and calculate their difference in a third cell. The result will automatically be presented as the number of days (including fractional days if applicable).
Unlike many programs, you will not code group information (control vs. treated in this example) into a single column of data. Instead, the outcome information (event of interest or censored observation) should be entered into separate columns (one column for each group in the study).
In the example above, there are three different reasons why observations were considered censored in this study:
•Three of the censored observations represent study participants who had not experienced the event of interest (in this case, were still alive) at the end of the study. We don’t know how much more time will elapse until they experience the event (i.e. how much longer they will live)
•Subject 7 moved away from the area, and thus left the study protocol. Even if we have information on how much longer the subject survived without experiencing the event of interest, we couldn’t use this information since they were no longer following the study protocol. We do know that subject 7 was observed for 732 days on the protocol without experiencing the event of interest, but we either don’t know or can’t use any information after that
•Subject 10 died in a car crash during the course of the study. Different investigators will handle this in different ways. When the event of interest is death, some investigators will simply define any death as the event, regardless of the cause. Others would define a death from a clearly unrelated cause (such as a car crash) to be a censored observation. We know that this subject was observed for 703 days on the treatment. However, we do not know how much longer they would have survived on the treatment if they had not died in the car accident
Note that the order in which data are entered into the rows of the data table is entirely irrelevant to survival analysis. The data above were entered in order of enrollment date, but they could be entered in any order and would generate the same results.