The data below represent information collected from an animal study that followed a group of animals for 28 days following treatment. All five control animals survived for the entire duration of the study, while three of the treated animals died (at days 15, 21, and 26). The other two treated animals were still alive at the end of the experiment on day 28. Here is how this data may appear when entered into Prism:
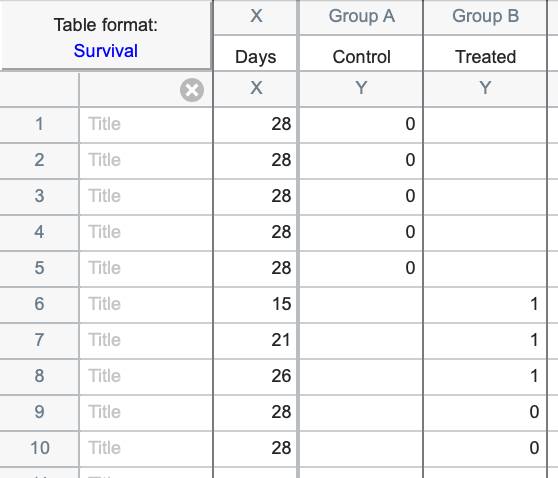
Note that although all five control animals have the same elapsed time of observation (X values), each one was entered into a separate row. Each of these rows have an X value of 28 (the number of days that the animals were observed) and a Y value of 0 (indicating that the animals were all censored). The observations for these animals is said to be censored because we only know that they lived for at least 28 days without experiencing the event of interest. We don’t know how much longer they would have survived because the study ended.
The five treated animals are also entered into separate rows, with a Y value of 1 indicating that the animal experienced the event of interest (death in this case), or a value of 0 if the observation was censored. In both cases where the animal was censored for this group, it is because - like the animals in the control group - they survived the entire duration of the study.
Data for each animal was entered into its own row. Thus, the number of rows in the data table is equal to the number of animals included in the study.