Prism offers four normality tests. Why is there more than one way to test normality? The answer has to do with the objective of all normality tests: to assess whether or not values come from a normal distribution. There are an infinite number of different ways that a distribution can deviate from normality, so it makes sense that there would need to be a variety of different kinds of normality tests. Each different normality test looks for something different in the data, and so each gives different results.
D'Agostino-Pearson: assessing normality with shape
The D'Agostino-Pearson normality test first computes the skewness and kurtosis to quantify how far the distribution is from Gaussian in terms of asymmetry and shape. It then calculates how far each of these values differs from the value expected with a Gaussian distribution, and computes a single P value from the sum of these discrepancies. It is a versatile and powerful normality test, and is generally recommended. However, it should be noted that there are exceptions to this recommendation. Specifically, when a distribution has a skewness and kurtosis that are very close to that of a normal distribution, but are definitely non-normal, this test will not be able to identify the distribution as being non-normal. An example is the distribution below.
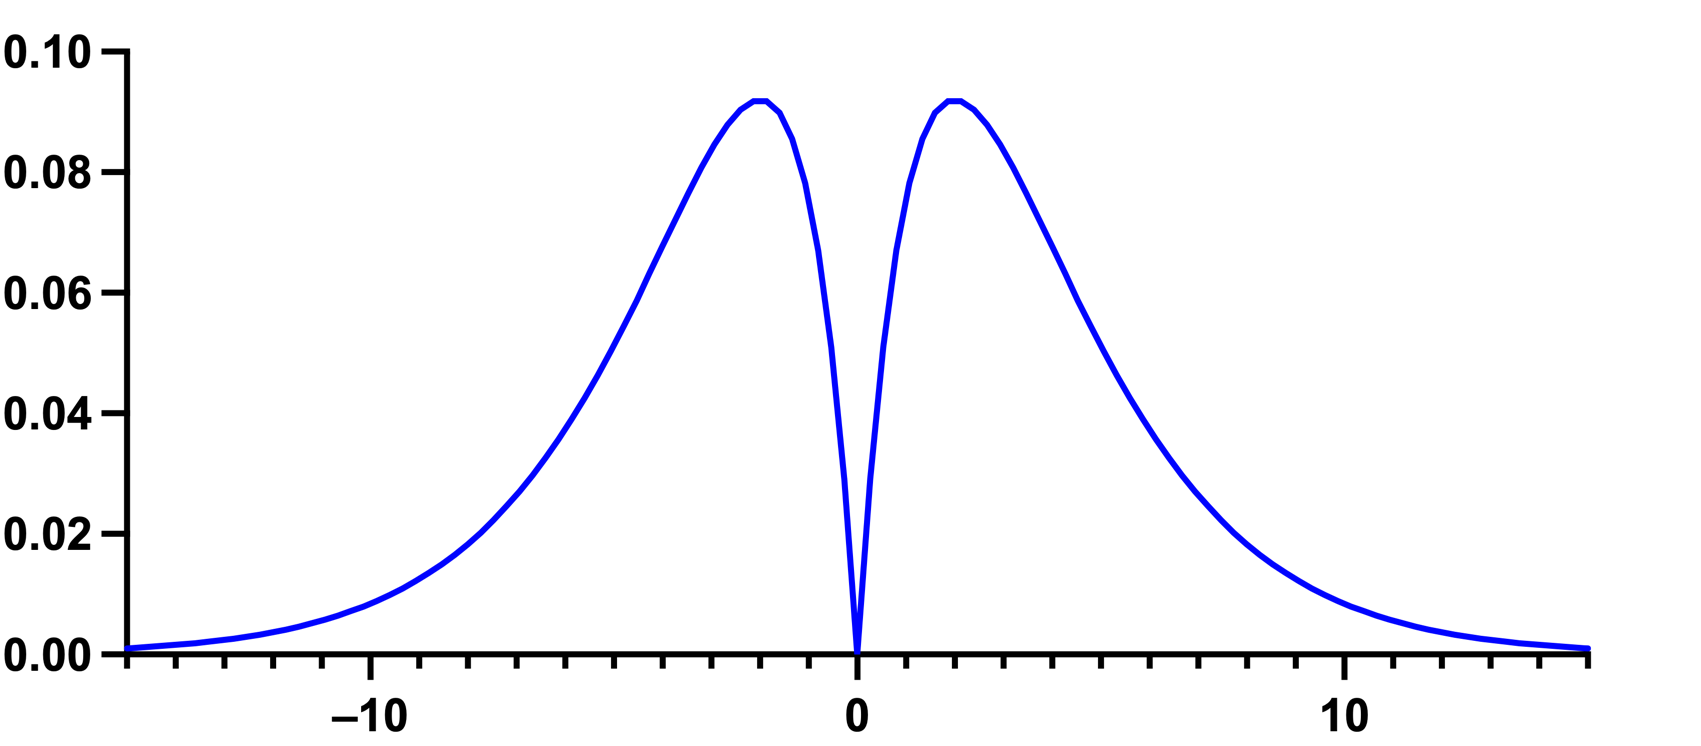
This distribution has a skewness of 0 and a kurtosis of 3.0 (an excess kurtosis of 0): the exact same values that a normal distribution has. As a result, the D’Agostino-Pearson test would not be able to identify this distribution as non-normal (even though it clearly is). Note that D'Agostino developed several normality tests. The one used by Prism is the "omnibus K2" test.
Shapiro-Wilk: assessing normality with standard deviation
The Shapiro-Wilk normality test is another popular option when it comes to normality tests. Unlike the D’Agostino-Pearson test, the Shapiro-Wilk test doesn’t use the shape of the distribution to determine whether or not it is normal. Instead, it compares the actual SD of the data to the SD computed from the slope of the QQ plot for the data, and calculates their ratio. If the data are sampled from a Gaussian distribution, the two values will be similar, so the ratio will be close to 1.0, while a ratio much different from one would suggest a non-normal distribution. The Shapiro-Wilk test works very well if every value is unique, but does not work as well when several values are identical. There are several ways to compute the Shapiro-Wilk test. Prism uses the method of Royston (1). Prism can only compute the Shapiro-Wilk test when the sample size is less than 5000.
Anderson-Darling and Kolmogorov-Smirnov: assessing normality with cumulative distributions
The Anderson-Darling test and the Kolmogorov-Smirnov test both use the cumulative distribution to determine whether or not the data were sampled from a normal distribution. Both tests compare the actual cumulative distribution to the ideal cumulative distribution of a normal distribution. However, the two tests differ in how this comparison is made.
The Anderson-Darling test computes the P value by comparing the cumulative distribution of your data set against the ideal cumulative distribution of a Gaussian distribution. It takes into account the discrepancies at all parts of the cumulative distribution curve.
Unlike the Anderson-Darling test, the Kolmogorov-Smirnov test computes a P value from a single value: the largest discrepancy between the cumulative distribution of the data and a cumulative Gaussian distribution. This is not a very sensitive way to assess normality, and we now agree with this statement: "The Kolmogorov-Smirnov test is only a historical curiosity. It should never be used." (2). The Kolmogorov-Smirnov test was the only test offered by earlier versions of Prism. We still offer this test (for consistency) but no longer recommend it. If we no longer recommend it, why is it still included? Originally, this test was the only normality test that Prism offered. We include it now only to provide consistency with files and results that were generated with older versions of the software. We do not recommend using the Kolmogorov-Smirnov test.
A note on the naming of the Kolmogorov-Smirnov test
The Kolmogorov-Smirnov method as originally published assumes that you know the mean and SD of the overall population (perhaps from prior work). When analyzing data, you rarely know the overall population mean and SD. You only know the mean and SD of your sample. To compute the P value, therefore, Prism uses the Dallal and Wilkinson approximation to Lilliefors' method (3). This is sometimes referred to as "Lilliefors' test". Since that method is only accurate with small P values, Prism simply reports “P>0.10” for large P values. In case you encounter any discrepancies, you should know that we fixed a bug in this test many years ago in Prism 4.01 and 4.0b.
So what should I do?
Which test(s) should you use? One possible answer is to not use any. Normality tests are way less useful than many scientists believe. Another answer is to run all of them and draw a conclusion by looking at all of the results. If you must pick one normality test, we'd suggest using the D'Agostino-Pearson test, but this is a very "soft" recommendation. As demonstrated above, there are cases where this test will simply fail to identify a distribution as non-normal (when it clearly is NOT normal).
Reference
1.P Royston, Remark AS R94: A Remark on Algorithm AS 181: The W-test for Normality. Journal of the Royal Statistical Society. Series C (Applied Statistics), Vol. 44, No. 4 (1995), pp. 547-551
2. RB D'Agostino, "Tests for Normal Distribution" in Goodness-Of-Fit Techniques edited by RB D'Agostino and MA Stephens, Macel Dekker, 1986.
3.Dallal GE and Wilkinson L (1986), "An Analytic Approximation to the Distribution of Lilliefors's Test Statistic for Normality," The American Statistician, 40, 294-296.