Analyzing column data
1.Create a Column data table so each data set is in a single Y column.
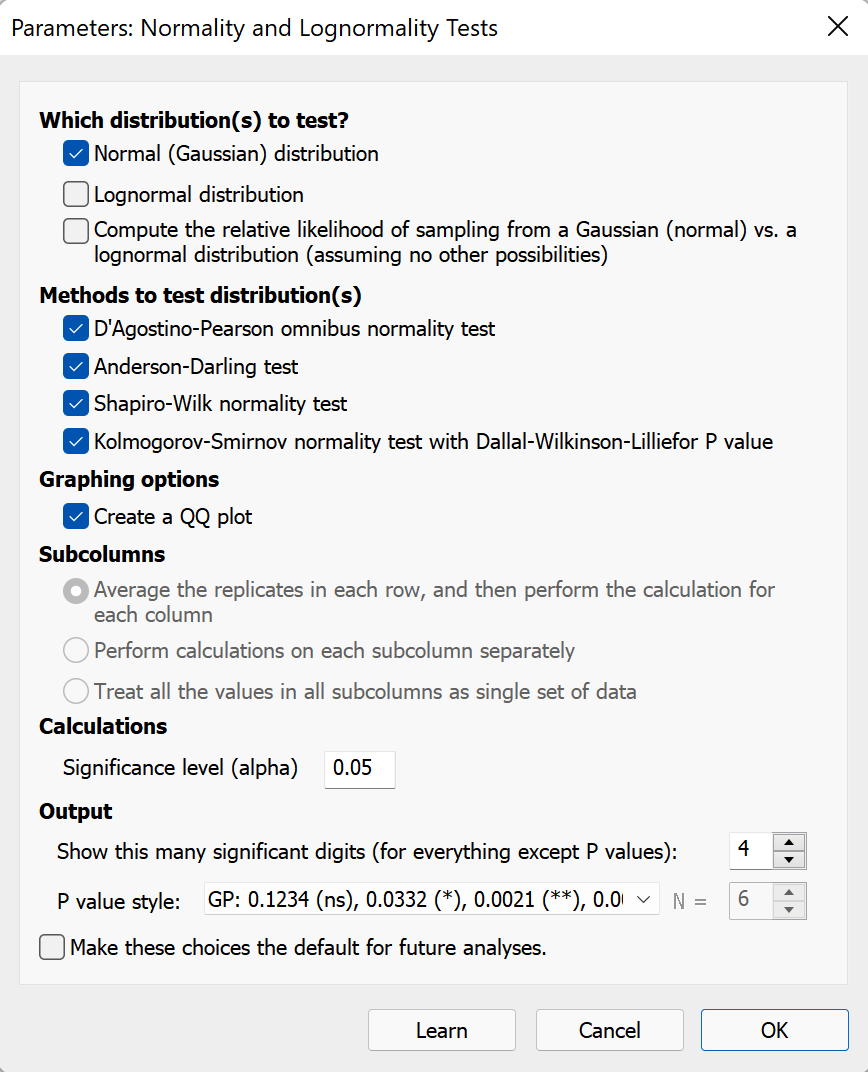
2.Click Analyze, look at the list of Column analyses, and choose normality tests.
3.Prism offers four options for testing for normality. Choose one, or more than one, of these options. You may also choose to test for lognormality and to compare normal and lognormal distributions.
Analyzing normality of residuals from nonlinear regression
A residual is the distance of a point from the best-fit curve. One of the assumptions of linear and nonlinear regression is that the residuals follow a Gaussian distribution. You can test this with Prism. When setting up the nonlinear regression, go to the Diagnostics tab, and choose one (or more than one) of the normality tests.
Analyzing normality of residuals from linear regression
Prism's linear regression analysis does not offer the choice of testing the residuals for normality. But this limitation is easy to work around. Run nonlinear regression, choose a straight line model, and you'll get the same results as linear regression with the opportunity to choose normality testing. This is just one of many reasons to fit straight lines using the nonlinear regression analysis.