Features and functionality described on this page are available with our new Pro and Enterprise plans. Learn More... |
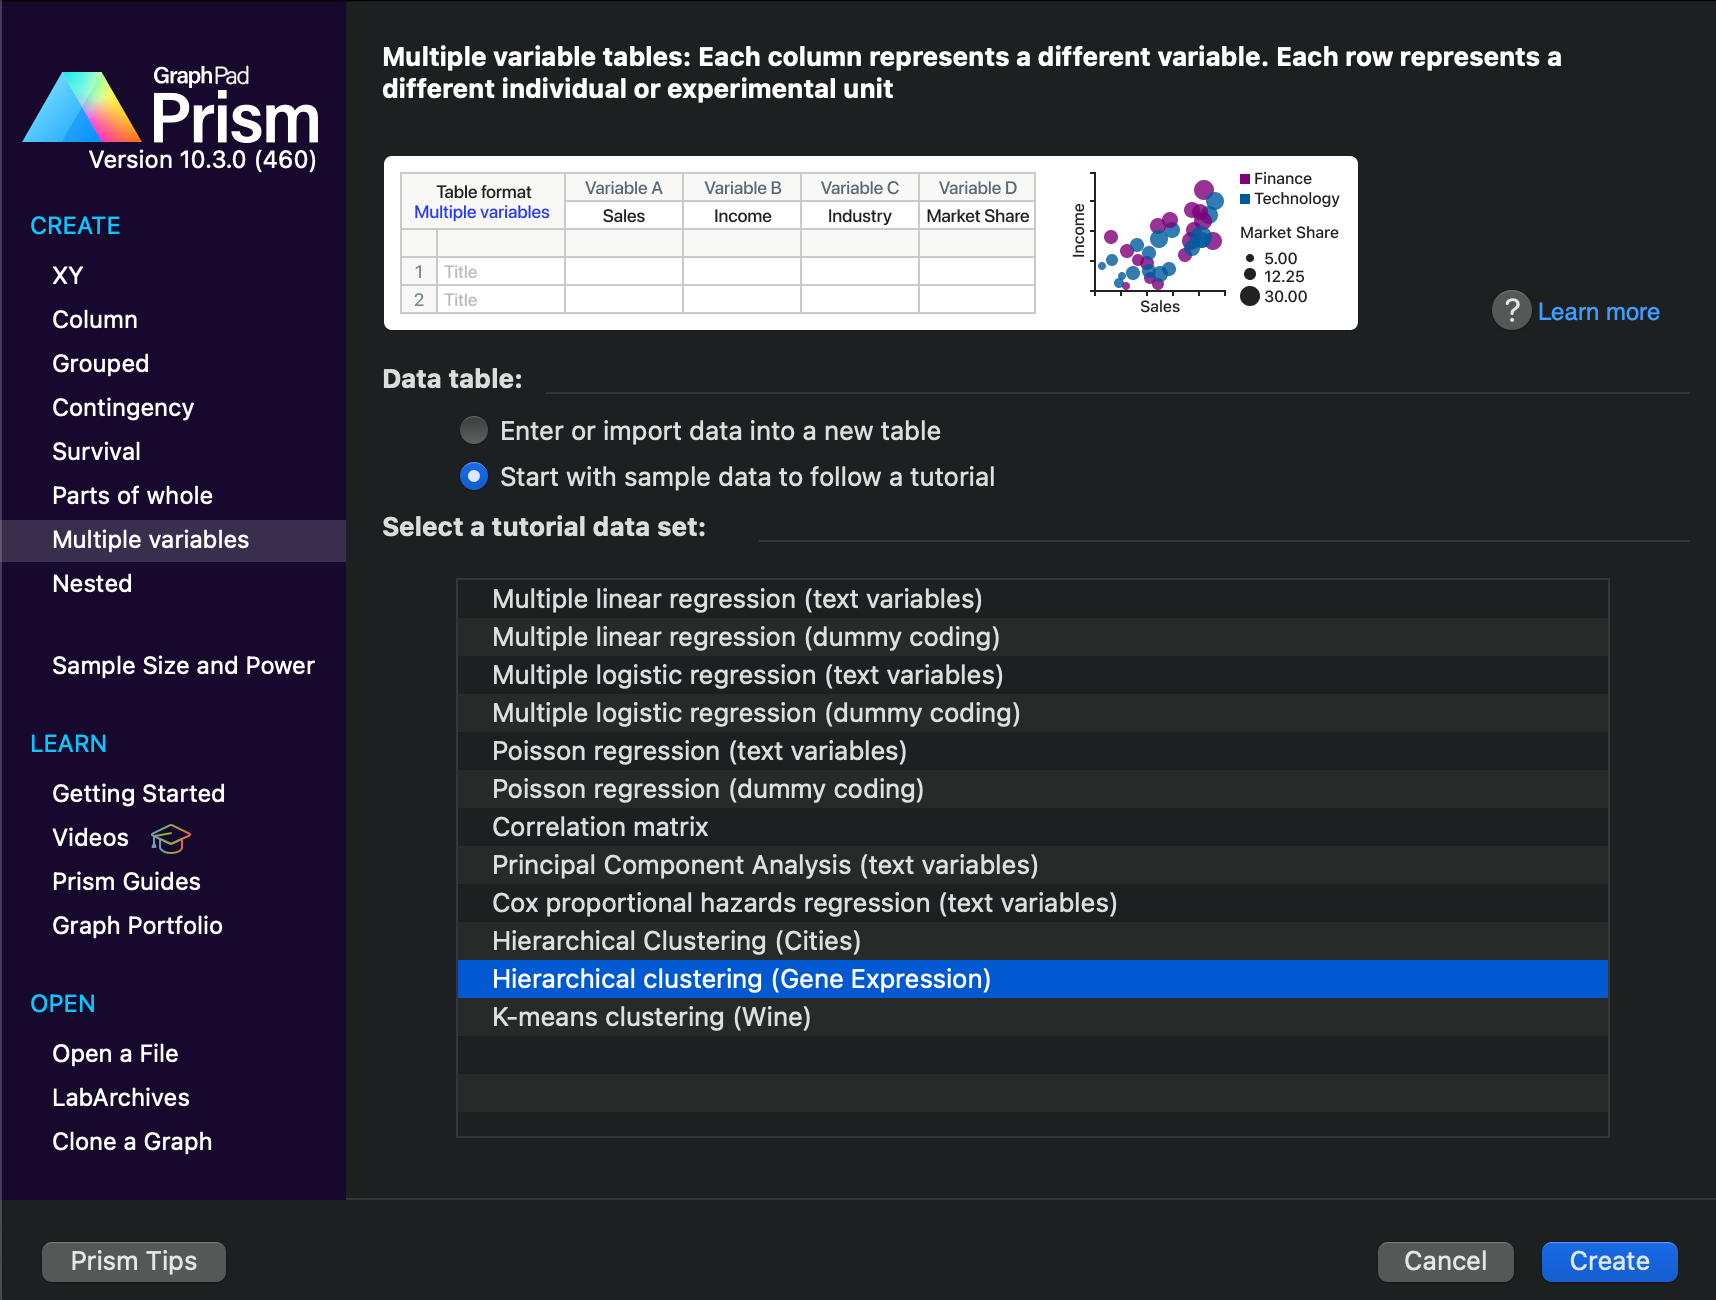
1.From the Welcome or new Table dialog, create a multiple variables data table.
The multiple variables data table is the only type of table that can be used to perform hierarchical clustering. You may either choose to enter your own data into a new table or to start with one of the hierarchical clustering sample data sets.
2.Enter the data.
Generally, each column of a multiple variables data table represents a different variable, while each row represents a different observation or experimental replicate (subject, object, individual, etc.). The default in Prism is to perform clustering on the rows of your data. However, it’s important to note that the hierarchical clustering algorithm can be applied to rows, columns, or both within the same analysis depending on the objectives of the analytical design. When clustering rows, the values within each row (and across all relevant columns) are used to define the “location” of that row which is then used to calculate distances. When clustering columns, the values within each column (and across all relevant rows) are used to define the “location” of that column which is then used to calculate distances. Because this analysis can be performed in either “direction”, you should be careful about how you enter your data and which direction of clustering you choose.
3.Perform the analysis
From the data table, click the Analyze toolbar button. Select Hierarchical clustering either in the Clustering analyses section or in the Multiple variable analyses section of the dialog, then click the OK button. This will invoke the Parameters: Hierarchical Clustering dialog which consists of four tabs:
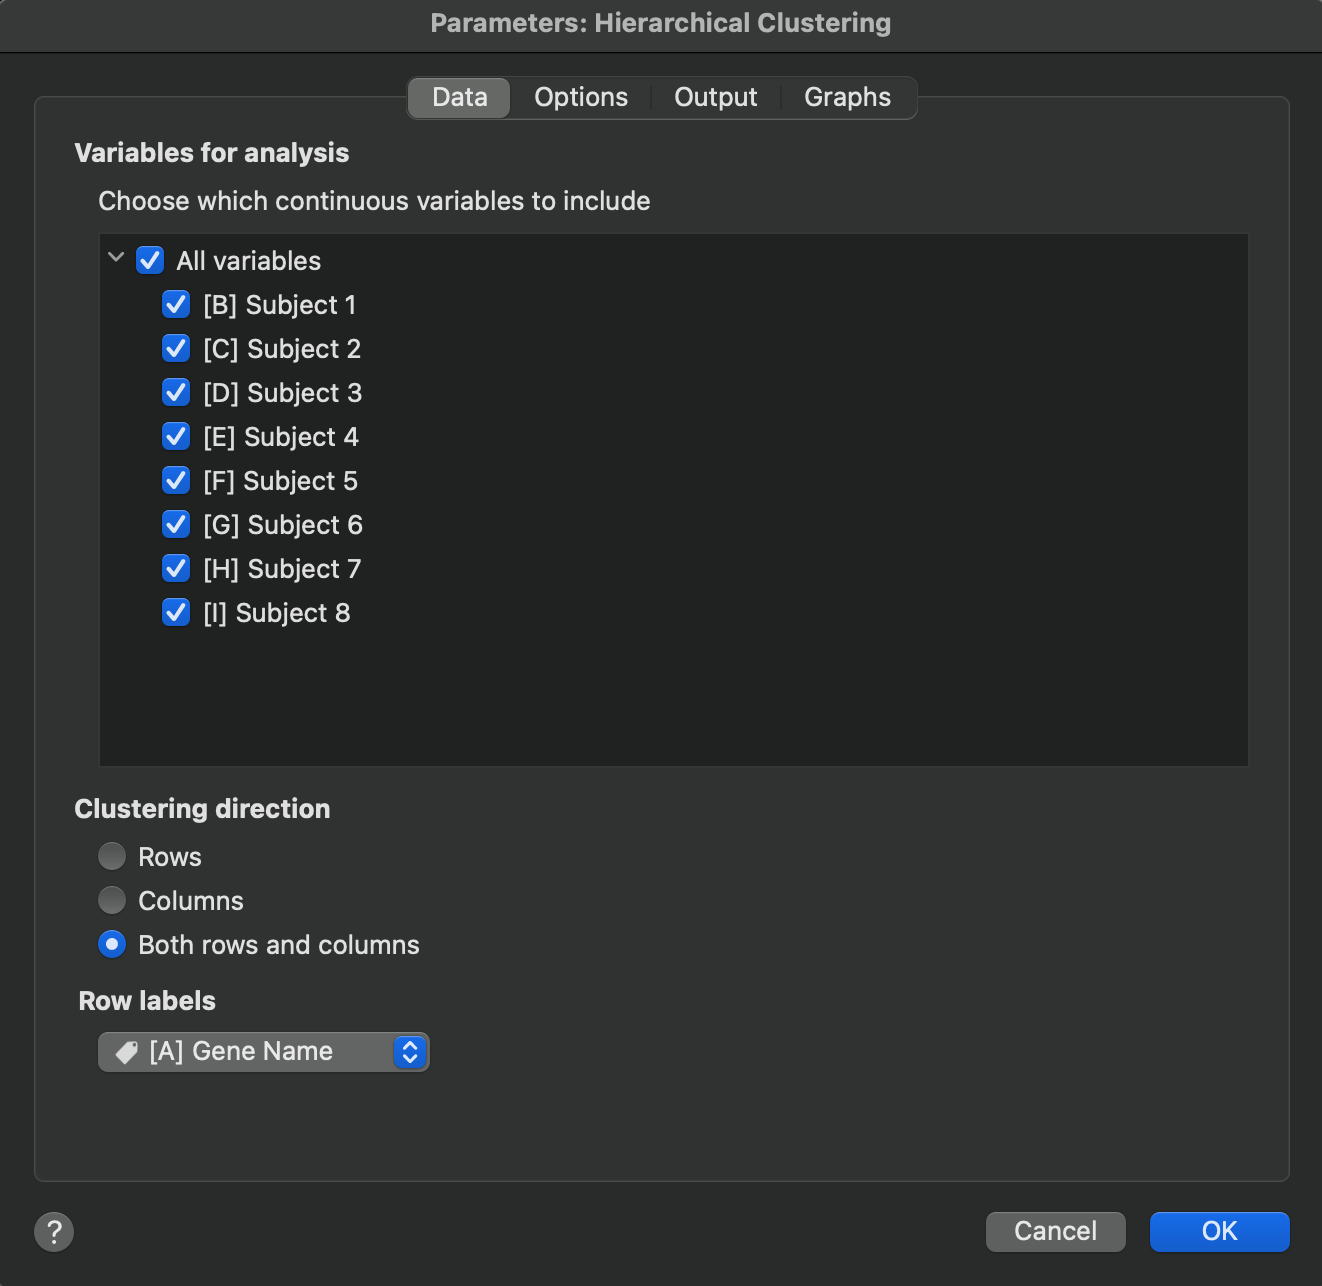
a.Data: Choose the variables (columns) that will be included in the analysis. Additionally, indicate if the clustering is to be performed on rows, columns, or both. Finally, choose which values to use as row labels (column/variable titles will be used as column labels if needed).
b.Options: specify the desired scaling method for columns and/or rows, choose a distance calculation method and a linkage method, and (optionally) define the number of desired clusters within rows or columns
c.Output: Customize the reported output generated by the analysis. Additionally, choose to report “full” or “half” matrices for the relevant output tables, and choose how many significant digits to report in these tables.
d.Graphs: Select which graph(s) Prism should generate as part of this analysis