When performing Cox proportional hazards regression, Prism provides two values that indicate the effect of each predictor variable on the hazard rate:
•The parameter estimates (discussed on a separate page)
•The hazard ratios (discussed below)
These two values are simple transforms of each other, and thus provide the same information. If you're new to Cox regression, understanding the hazard ratios is probably a bit easier.
Simple version
Hazard ratios represent the “multiplicative effect” that a given parameter has on the outcome. If a parameter has a hazard ratio of 2, then an increase of 1 in that parameter’s value will double the hazard rate across all time points.
Detailed version
Hazard ratios are a transformation of the parameter estimates calculated for Cox proportional hazards regression, and described previously. As mentioned before, these parameter estimates (beta values) indicate the amount that the log(hazard rate) changes as a result of a change in the value of the corresponding predictor variable. However, thinking about log(hazard rates) is a bit more complicated than considering simple hazard rates. Hazard ratios are used to indicate how much the hazard rate changes when the predictor variable associated with this hazard ratio changes.
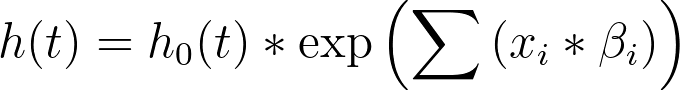
Consider the model that Cox proportional hazards regression uses:
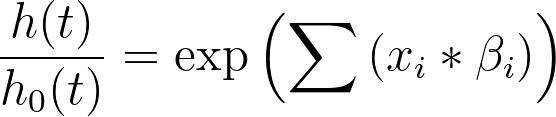
Another way to present this model is to divide both sides by the baseline hazard (h0(t)):
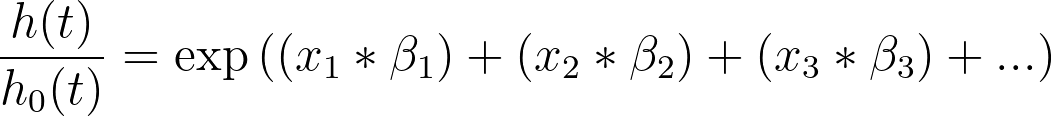
This can be expanded in the following way:
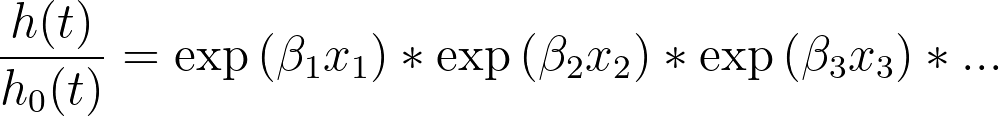
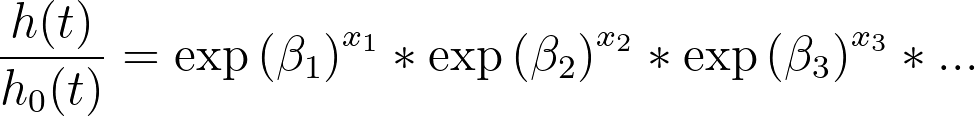
If we replace the term “exp(β1)” with “HR1”, we get
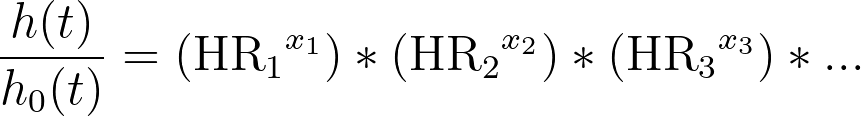
This final form of the equation clearly demonstrates the relationship between the parameter estimates and the hazard ratios: if you exponentiate the parameter estimate for a given predictor variable, you obtain the hazard ratio. Using this knowledge, it can now be seen that these values for the hazard ratios have the following interpretation:
For a given hazard ratio HRi, a one unit increase in xi has a multiplicative effect equal to the value of the hazard ratio on the hazard rate when all other predictor variable values are held constant.
As a simple example, consider the predictor variable “Age in years” with a hazard ratio of 2. When Age increases by one year, the hazard rate will be multiplied by a value of 21 (or just 2). When age increases by two years, the hazard rate will be multiplied by a value of 22 (or 4). The hazard ratio provides the “multiplicative effect” that the predictor variables have on the hazard rate.
Prism also provides confidence intervals for these hazard ratios. Confidence intervals are often misunderstood statistical concepts because they aren’t quite what our intuition wants them to be. A proper interpretation of a confidence interval would read: “If we repeated this experiment over and over - selecting observations from the same population each time - we would expect that 95% of the corresponding 95% confidence intervals would include the true population value.”