When performing Cox proportional hazards regression, Prism provides two values that indicate the effect of each predictor variable on the hazard rate:
•The parameter estimates (discussed below)
•The hazard ratios (discussed on a separate page)
These two values are simple transforms of each other, and thus provide the same information. If you're new to Cox regression, understanding the hazard ratios is probably a bit easier.
Information on P values calculated for these parameter estimates and hazard ratios can be found on its own page.
Parameter estimates
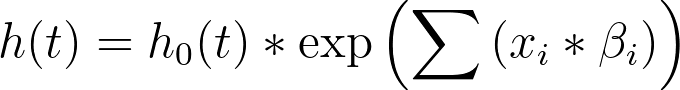
Interpretation of parameter estimates in Cox proportional hazards regression is somewhat more complicated than it is for other forms of multiple regression offered by Prism. This is because the model that is used by Cox proportional hazards regression investigates relationships between the predictor variables and the hazard rate. For reference, here is the general model:
Another way to present this model is to divide both sides by the baseline hazard (h0(t)) and to take the natural logarithm, resulting in:
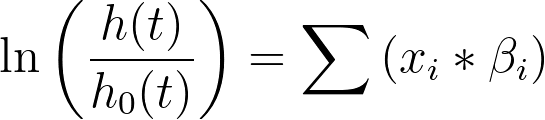
This is the form of the model from which the parameter estimates can be understood. For example, consider an analysis in which the only predictor variable was the continuous variable “Age”. If the parameter estimate for Age was 0.5, the model would look like this:
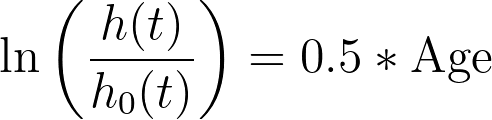
Based on this model, it can be seen that if the value of Age is increased by one, the value of the log(hazard rate) will increase by one half. Although these parameter estimates present the effects of log values (which can be difficult to understand in absolute terms), they do present one very nice benefit: positive values for parameter estimates indicate that an increase in this predictor variable results in an increase in the hazard rate, while negative values for parameter estimates indicate that an increase in this predictor variable results in a decrease of the hazard rate.
Remember that an increase in hazard rate corresponds to an increased risk of experiencing the event of interest, while a decrease in the hazard rate corresponds to a decrease in the risk of experiencing the event of interest.
Standard error and confidence intervals
Parameter estimates - as the name implies - are simply estimated values of some unknown value for the entire population. The only way to know the true value for a parameter is to collect data on the entire population. For example, if you wanted to know the average height of humans, you could (hypothetically) measure the height of every single human being. However, since you can’t actually do this, you instead collect a sample of data. From this sample, you calculate an average, and this average will have some error due to the random variability in the subjects that you selected. In Cox proportional hazards regression, Prism reports two values that provide an idea as to the amount of error in the estimates provided for the parameter coefficients: standard error and profile likelihood confidence intervals.
The standard error of a coefficient can be difficult to interpret, but in simple terms, it provides an idea for how precise the parameter estimate is.
Another way to look at this concept of precision is by using confidence intervals. These values provide some idea of how sure you can be of the provided parameter estimate. The general idea of confidence intervals is that - if you were to repeat the same experiment a huge number of times and construct confidence intervals for each repeated experiment - 95% of these intervals (for a 95% confidence interval) would contain the true parameter coefficient for the whole population. Note that some software reports symmetric confidence intervals which are calculated directly using the standard error mentioned above. Prism actually calculates more accurate profile likelihood confidence intervals. These can be (and usually are) asymmetric around the estimated parameter value.