Typically, survival curves are plotted to represent the probability of survival over time (starting at time zero). These curves will start at 100% (or 1 if displaying survival as fractions) and decrease over time. Mathematically, survival curves represent the probability that the event of interest has not occurred by a given time “t”. Thus, at time zero, when the survival curve is at 100%, this indicates that there is a 100% chance that the event of interest has not yet occurred.
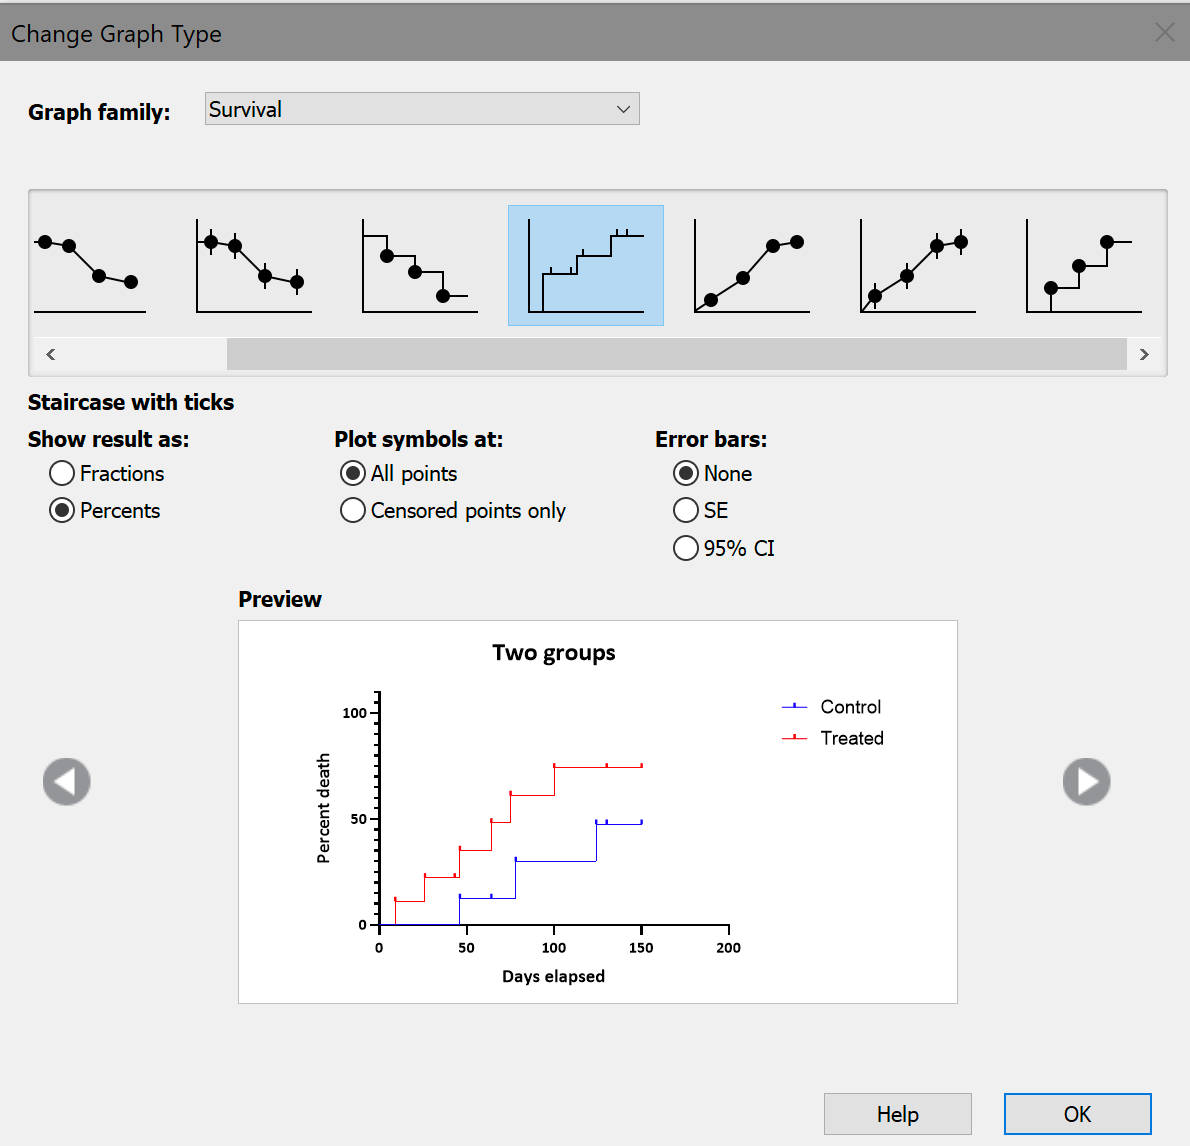
Cumulative incidence graphs show the opposite relationship, providing the probability that the event of interest HAS occurred by a given time “t”. This can be mathematically described as being 1 - survival probability. Thus, these graphs start at 0 and increase to a maximum of 1 (as a fraction) or 100 (as a percent). To create a cumulative incidence graph, select one of the corresponding graph types in the Change Graph Type dialog.