Prism will automatically analyze data entered into a survival data table, and will prepare a graph of the resulting Kaplan-Meier survival curves. When you first navigate to the graph, you will be presented with a dialog that provides some basic options for graph customization. Most of these options are self-explanatory.
Beginning in Prism 10.5.0, you may also choose to include a number at risk table as part of the graph of the survival curves for this analysis.
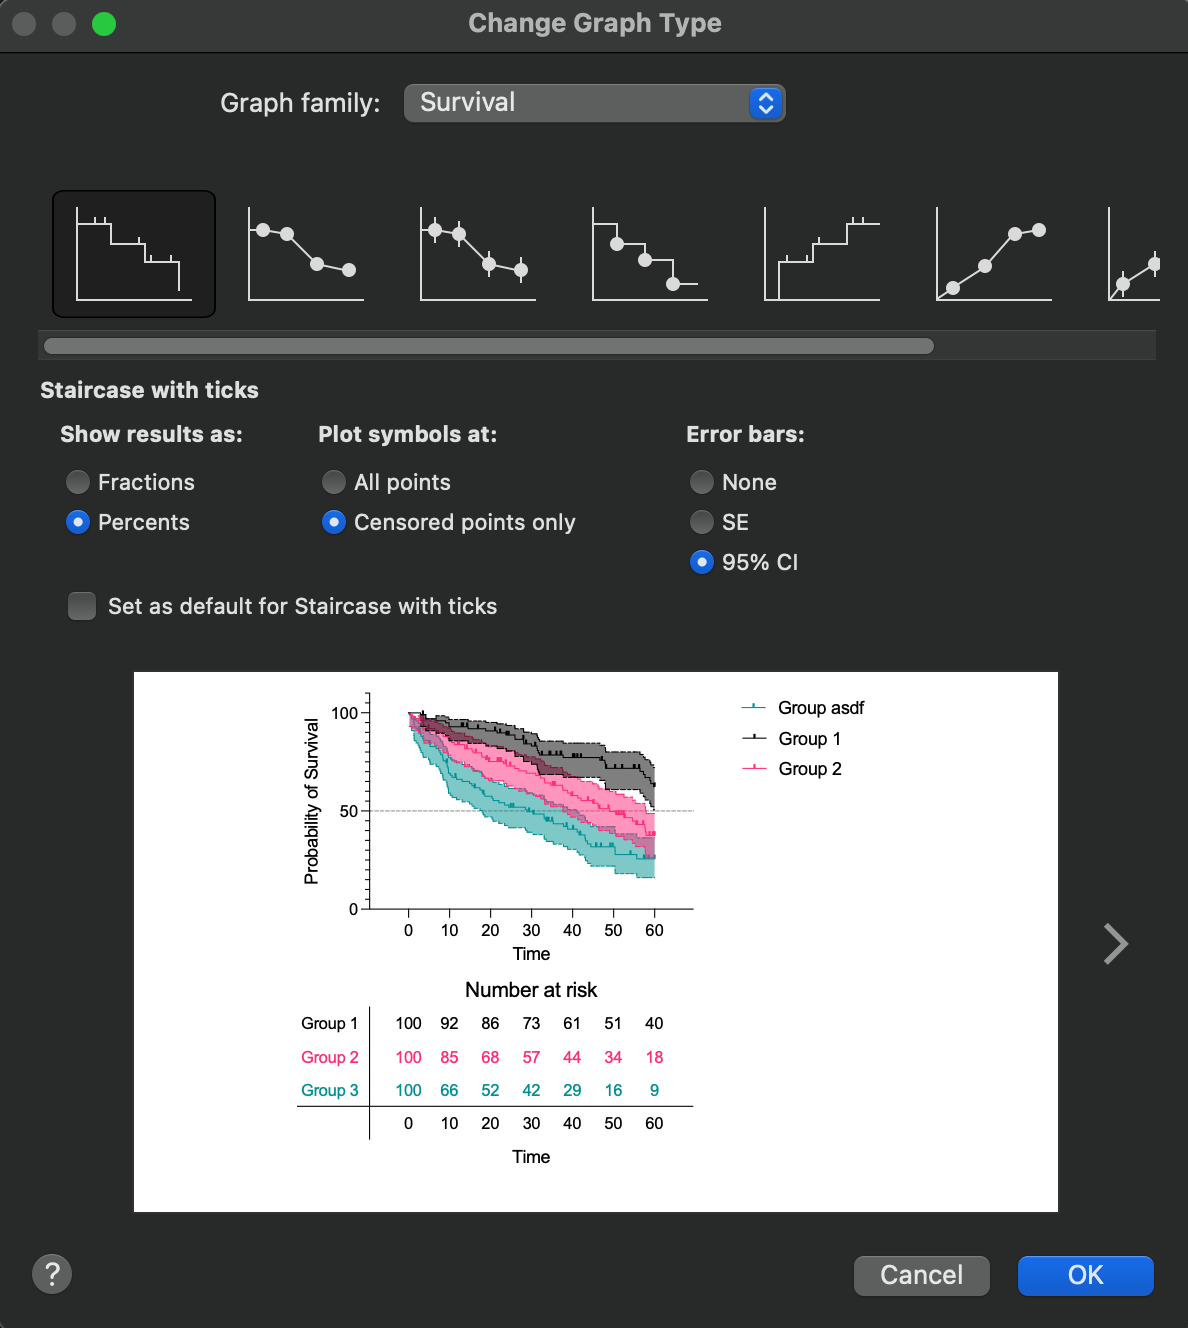
Show results as:
Should survival be plotted as a fraction (from 0 to 1) or as a percent (from 0% to 100%)?
Plot symbols at:
Should Prism include symbols on the graph for all observations, or only for censored observations? It’s most common to only include symbols for censored observations
Error bars:
The default is to not display error for these Kaplan-Meier survival curves. However, you can choose to display error bars for the standard error at each time point, or to display the 95% confidence interval as upper and lower bands for each curve