Experimental design
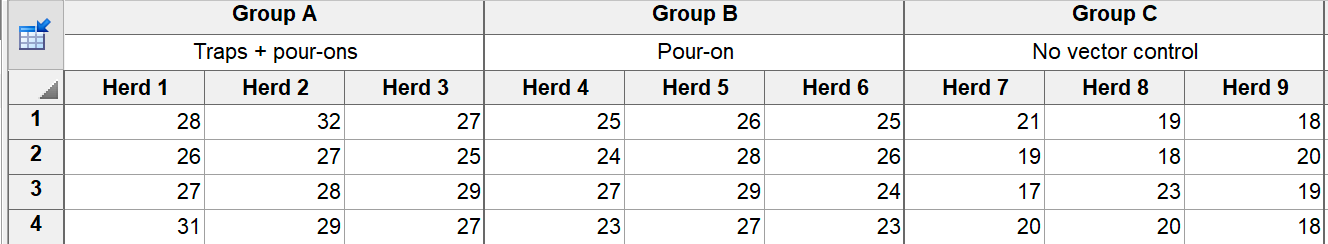
This example comes from the excellent on-line statistics text titled How to Avoid and Detect Statistical Malpractice. The study assesses the effect of two methods of disease vector control versus no control on the packed cell volume (PCV) of cattle. Three herds of cows are randomly assigned to each of the three treatments. Blood samples are taken from four cows from each herd, and packed red cell volume is tabulated.
The factor we care about is treatment. The nested factor is herd. Each herd only gets one treatment, so herd is nested within treatment.
Why is this nested?
This design is said to be nested because each herd was either a control or treated in one way. You cannot ask whether some herds respond better to treatments than others, because each herd only got one of the alternative treatments. Herds are said to be nested within treatment.
This is also called a hierarchical design. Hierarchical and nested are synonyms for describing this kind of design.
Incorrect analysis: one-way ANOVA of all data
It is tempting, but not appropriate, to treat these data as n=12 in each of the three treatment group.
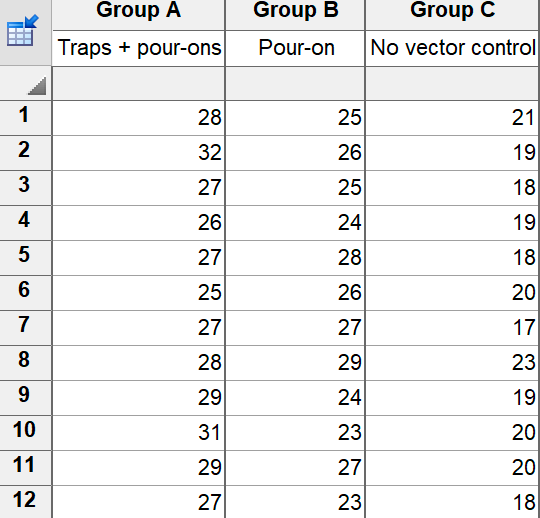
If you run one-way ANOVA on these data, the results will not be meaningful. ANOVA assumes that each value provides independent information. Three herds provided information for each treatment, with data from four cows in each herd. You do not have twelve independent measurements for each treatment. The replicates for each cow from one herd are closer to each other than to cows in other herds.
If you analyze the data this way, the P value is almost certainly going to be too small and the confidence intervals for the differences between means will be too narrow.
Incorrect analysis: two-way ANOVA
The data as shown at the top of this page appear to be set up for two-way ANOVA. But running a two-way ANOVA would lead to incorrect or misleading results. Two-way ANOVA would assume that all the cows whose data are in row 2 are somehow related to each other. But they are not. But in fact the order of the values in each subcolumn is arbitrary, so testing cow as a "factor" in two-way ANOVA would make no sense.
Alternative analysis without nested ANOVA (but only when sample sizes are equal)
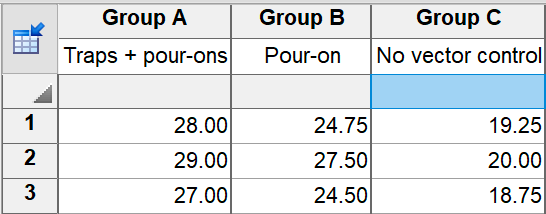
If there are no missing values, you can analyze the data with one-way ANOVA. The first step is to average the technical replicates for each herd. Then enter those means on a new table, and then compare the three sets of means with one-way ANOVA.
Note that the three herds in each treatment group are stacked in a column for the one-way ANOVA, but are side by side in subcolumns for the nested t test.
With no missing data, one-way ANOVA of these mean data will be identical to nested one-way ANOVA of the entire data set.