Experimental design
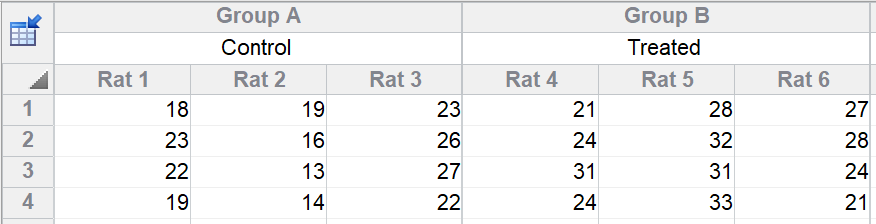
You measure a variable in control and treated rats. There were three rats in each group, and you measured four technical replicates in each rat. Note that the four values stacked in each subcolumn are in arbitrary order. There is no time course or any other meaning to order of the four rows.
Why is this nested?
This design is said to be nested because each rat was either a control or treated animal. You cannot ask whether some rats respond better to treatments than others, because each rat only got one of the alternative treatments. Rats are said to be nested within treatment.
This is also called a hierarchical design. Hierarchical and nested are synonyms for describing this kind of design.
Incorrect analysis: t test of all data
It is tempting, but not appropriate, to treat these data as n=12 in each group.
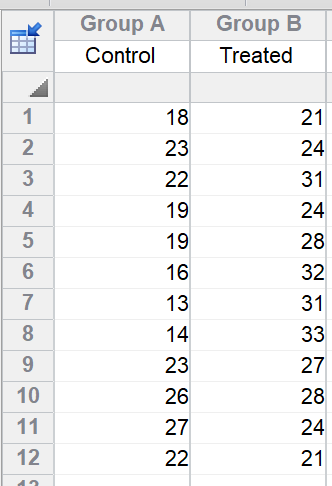
If you run a t test on these data, the 95% confidence interval for the difference in means runs from 3.2 to 10.5 and the two-sided P value testing the null hypothesis of sampling from a population where the means are identical is 0.0008. This seems to be convincing evidence that the treatment increased the outcome variable. But theses results are not meaningful.
Why not? Because the t test assumes that each value provides independent information. These data have three independent rats for each treatment, but do not have twelve independent measurements of outcome. The replicates for each animal are closer to each other than to the values obtained from other animals. Another way to say this is that when you combine the three replicate rats and the four technical replicates within each rat, the 12 resulting values are pseudoreplicates. Analyzing pseudoreplicates as if they were actual replicates gives you a confidence interval that is too narrow and a P value that is too small.
Incorrect analysis: two-way ANOVA
The data as shown at the top of this page appear to be set up for two-way ANOVA. But running a two-way ANOVA would lead to incorrect or misleading results. Two-way ANOVA would assume that the kind of rat whose data is in row 2 is somehow exposed to control and treated conditions. But in fact the order of the values in each subcolumn is arbitrary, so testing the rows as a "factor" in two-way ANOVA would make no sense.
Alternative analysis without nested t test (works only when sample sizes are equal)
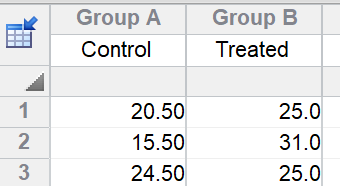
If there are no missing values, you can analyze the data with a t test. The first step is to average the technical replicates for each rat. Then enter those means on a new table, and then compare the two sets of means with an unpaired t test. Note that the three rats in each group are stacked in a column for the t test, but are side by side in subcolumns for the nested t test.
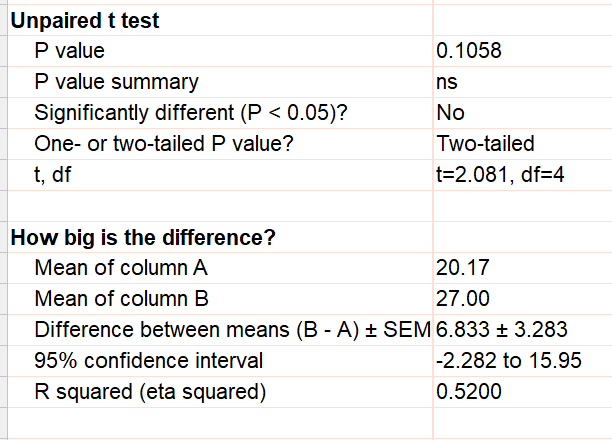
So long as there are no missing values, this gives the correct result. With this correct result, the 95% confidence interval for the difference runs from -2.3 to 15.9 and the P value is 0.1058. Note that the conclusion here (no evidence of treatment effect) is very different than the incorrectly conclusion you'd reach from analysis of the pseudoreplicates.
Nested t test in Prism
Prism 8 introduces a new analysis, Nested t test, that does the analysis in one step and can handle missing values. It assumes that the subcolumn means are sampled from a Gaussian population of subcolumn means, and that the replicates within the subcolumns are sampled from a Gaussian population. The two Gaussian populations will generally have different standard deviations, and Prism calculates (estimates) both and reports them as both SD and Variance.