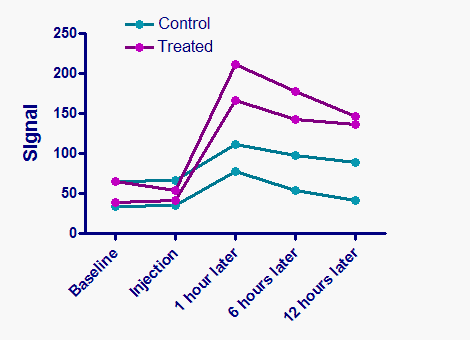
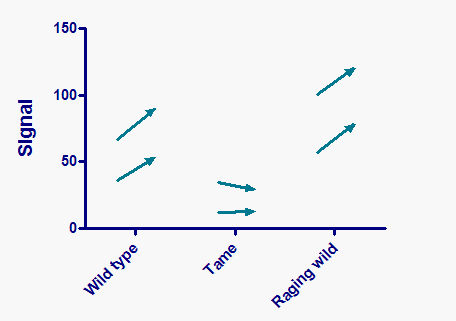
Graphing two-way ANOVA with repeated measures by row
From the New Graph dialog, you can choose a graph designed for repeated measures by rows or by columns.
Customize the graph within the Format Graph dialog:
•The appearance (for all data sets) should be 'Before-After'.
•Plot either symbols and lines or lines only. Choose the latter if you want to plot arrows.
•The line style drop down lets you choose arrow heads.
Graphing two-way ANOVA with repeated measures by column
From the New Graph dialog, you can choose a graph designed for repeated measures by rows. This is the second choice on the bottom row of graphs in the two-way tab.
Customize the graph within the Format Graph dialog:
•The appearance (for all data sets) should be "Each replicate".
•if you plot the replicates as 'Staggered", Prism will move them right or left to prevent overlap. In this example, none of the points overlap so 'Staggered' and 'Aligned' look the same.
•Check the option to plot 'one line for each subcolumn'.

