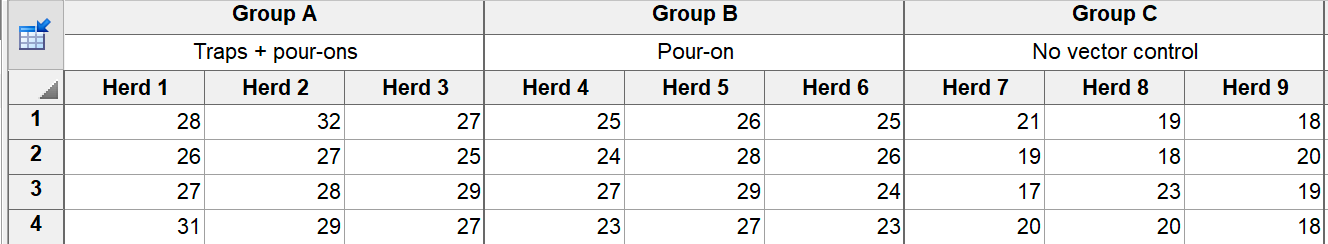
This example comes from the excellent on-line statistics text titled How to Avoid and Detect Statistical Malpractice. The study assesses the effect of two methods of disease vector control versus no control on the packed cell volume (PCV) of cattle. Three herds of cows are randomly assigned to each of the three treatments. Blood samples are taken from four cows from each herd, and packed red cell volume is tabulated.
The factor we care about is treatment. The nested factor is herd. Each herd only gets one treatment, so herd is nested within treatment.
1. Data entry
Create a Nested table, and set it up the number of subcolumns corresponding to the number of actual replicates you have. In the example, there are three herds in each treatment group, so create the table with three subcolumns.
Enter the data with the data from replicate cows stacked.
To label the subcolumns appropriately ("Herd1"... below), double click on a subcolumn header to bring up the dialog where you enter subcolumn titles.
Notes:
•Note that the replicates are stacked. This is different than Prism usually works. We set it up this way for two reasons. First, it lets you label the subcolumns ("Herd 1", "Herd 2"...above). Second, it matches the way most texts do this analysis. If the technical replicates were side by side with different rats in different rows, Prism's nested t test analysis would give meaningless results.
•The order of values in each subcolumn is arbitrary. You could randomly scramble the data in each subcolumn and the results won't change. The values in row 2 are not at all matched to each other.
•The order of the subcolumns doesn't matter. If you swapped the data for Herd 2 and Herd 3, the result would be the same. There is no connection between, say, the second subcolumn for the control data and the second column for the treated data.
•In this example, every subcolumn has the same number of values (4). Nested one-way ANOVA does not require this and works fine with unequal sample sizes.
•We use the name "nested one-way ANOVA" because it best describes the use of this test. Most books call this nested two-way ANOVA, because one factor (herd in this example) is nested within another factor (treatment).
•Prism cannot run nested ANOVA with huge data sets and presents an message telling you so. How huge is huge? Details here
2. Run the analysis
Click Analyze and then choose nested one-way ANOVA from the list of Grouped analyses.
On the first tab, choose whether or not to generate a graph of the grand mean and 95% confidence interval for each data set, and whether or not to display the goodness of fit in the tabular results.
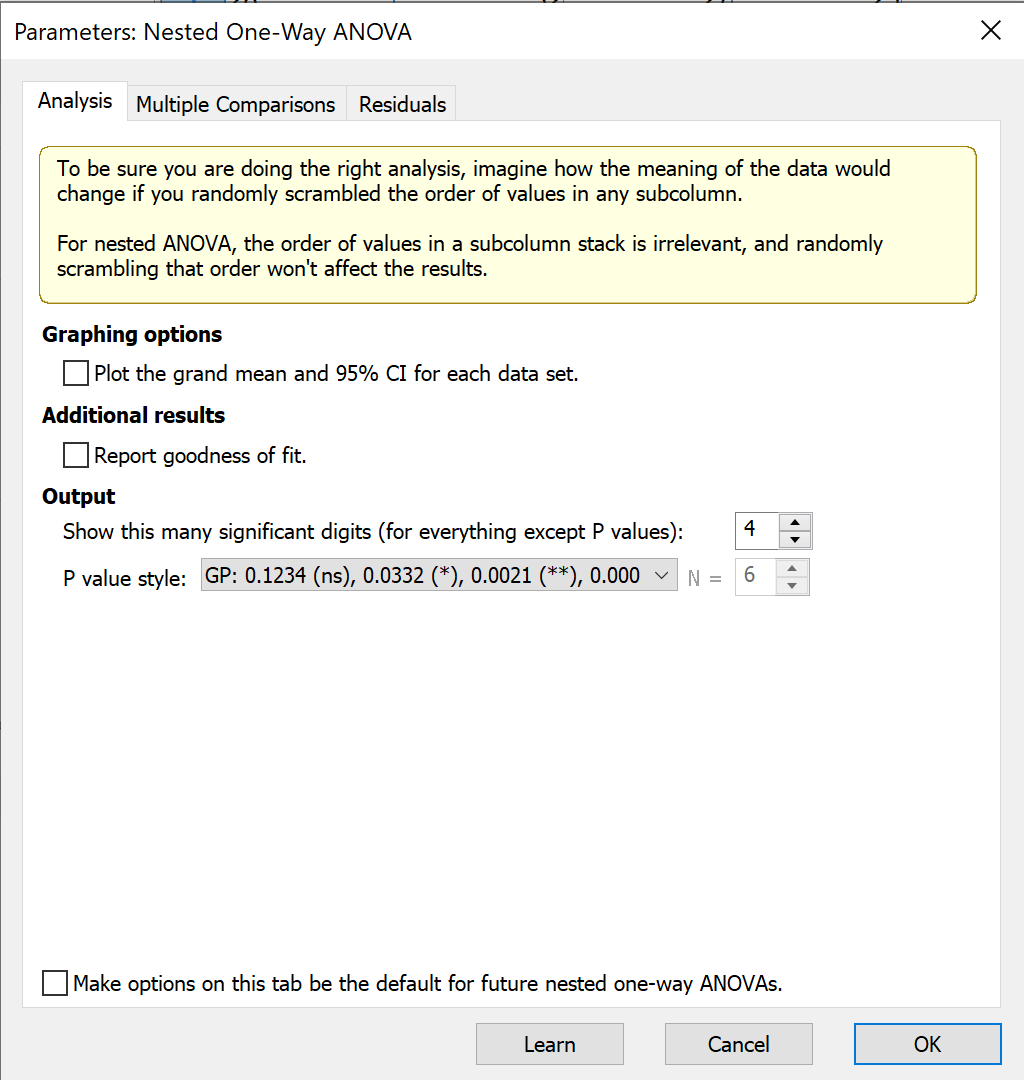
The second tab offers options for multiple comparisons, and the third tab gives several choices for plotting residuals.