Main results
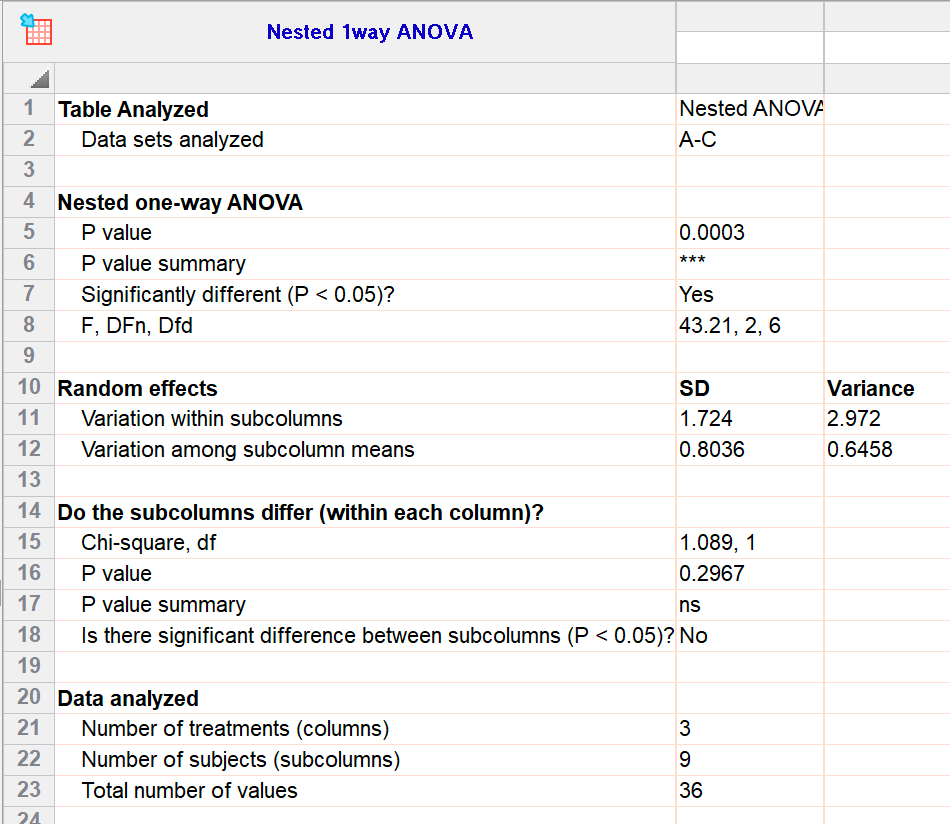
•Nested ANOVA. This P value tests the null hypothesis that the three columns (treatments in this example) are the same on average.
•Random effects. The variation among subcolumn means and within subcolumns, expressed as both standard deviations (easier for scientists) and variances (more familiar to statisticians).
•Do the subcolumns differ (within each column). This P value tests the null hypothesis data for all subcolumns are sampled from populations with identical standard deviations.
•Goodness of fit (optional). If you choose this option, Prism reports the number of df and the REML criterion, which will only be meaningful to a statistician familiar with mixed models.
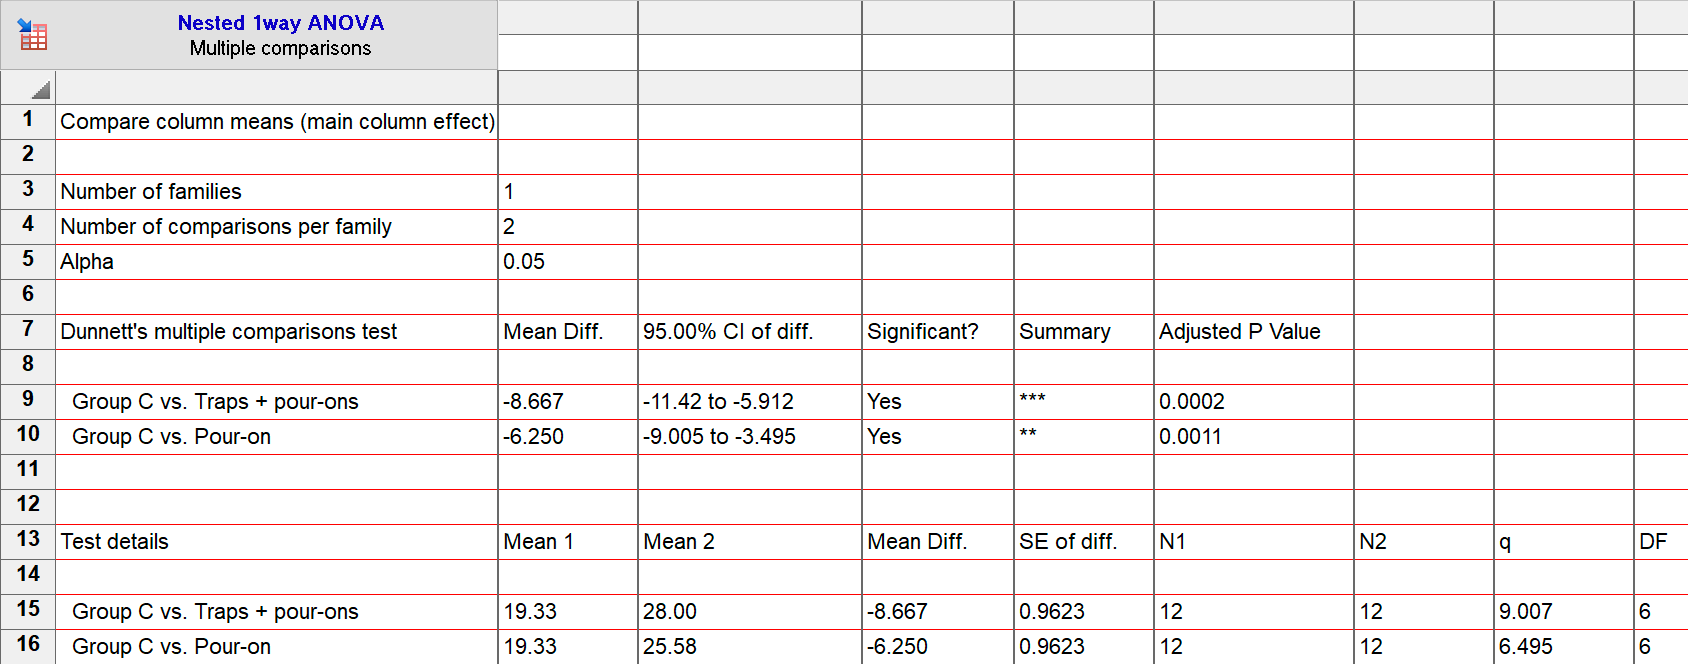
Multiple comparisons
Multiple comparisons are done as they are for one-way ANOVA. For this example, it makes sense to compare both treatments to the control in the third column with Dunnett's test. Here are the results.