Distinguish the t test analysis from the multiple t test analysis
Both the (single) t test (and nonparametric) analysis and the multiple t test (and nonparametric) analysis are designed to compare two groups of values. However, the way that the data should be organized for each of these analyses is different, and care should be taken not to confuse these two. The following two sections highlight the differences between these two analyses.
(Single) t test (and nonparametric) analysis
•The (single) t test (and nonparametric) analysis performs only one t test, comparing two columns of data
•The (single) t test (and nonparametric) analysis is designed to analyze data from the Column format data table. Data should be entered into two columns with no side-by-side replicates. Each column should contain values from one of the two groups being compared, with replicates being "stacked" within their column (read more)
•This analysis can also be used to compare "matched" or "paired" data. Paired data should be entered on the same row, with observations from each group entered into their respective columns
Multiple t test (and nonparametric) analysis
•The multiple t test (and nonparametric) analysis performs many t tests at once, with each test comparing two groups of data
•The multiple t test (and nonparametric) analysis is designed to analyze data from the Grouped format data table. Data for each individual t test should be entered onto a single row of the data table. Two columns (each with an appropriate number of subcolumns) represent the two groups being compared. Replicates for each group should be entered into side-by-side subcolumns
•The multiple t test (and nonparametric) analysis can also be used to compare "matched" or "paired" data. Paired data should be entered such that the pairs of values are in the same subcolumn within their groups' column (for example, if a paired test is selected, the value in subcolumn Y2 of column A will be matched to the value in subcolumn Y2 of column B).
•Note that there is no pairing or matching of values stacked in a subcolumn. The value in row 1 and subcolumn Y2 of Column A is not matched to the value in row 2 and subcolumn Y2 of Column A. (Violating this assumption won't change the results.)
How to perform a multiple t test analysis with Prism
1.Create a Grouped data table. Format the table either for entry of replicate values into subcolumns, or for entry of mean, SD (or SEM) and n (Paired tests will be unavailable unless raw replicate values are entered directly into the data table).
2.Enter the data on two data set columns. One test will be performed on each row of data.
3.Click Analyze, and choose "Multiple t tests (and nonparametric) - one per row" from the list of analyses for Grouped data.
4.Choose how to compute each test, and when to flag a comparison for further analysis.
If you want to copy/paste (or export) the P values from the analysis results to another table or program
Note a potential problem when copying the P values (or adjusted P values) to another program. If any P values (or adjusted P values) show something like "<0.000001", when you copy and paste that value will be seen as text and may get ignored. To avoid this issue you need to do two things.
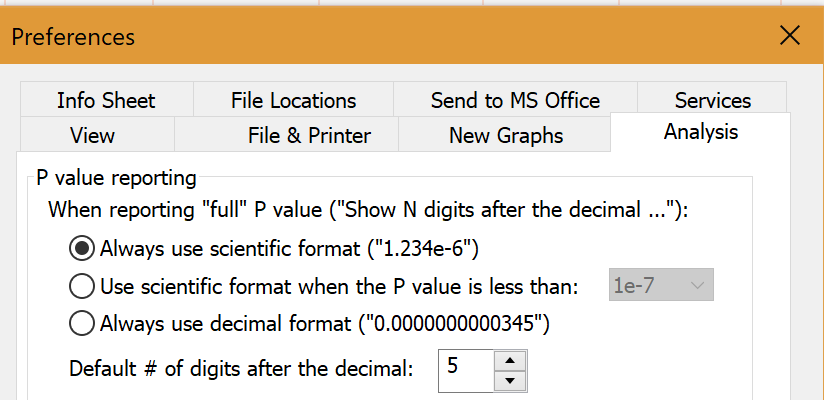
•In the Analysis tab of Preferences, choose either to always report P values in scientific format, or at least to report tiny P values in scientific format.
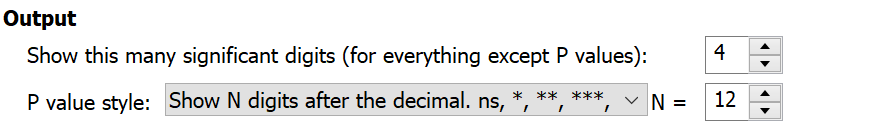
•In the parameters dialog for the multiple t test analysis, choose to report P values with N digits after the decimal and enter a large value for N.
Once you have made both of these choices, all P values will be numbers and the less than "<" symbol won't appear to confuse things.