Important results
P value
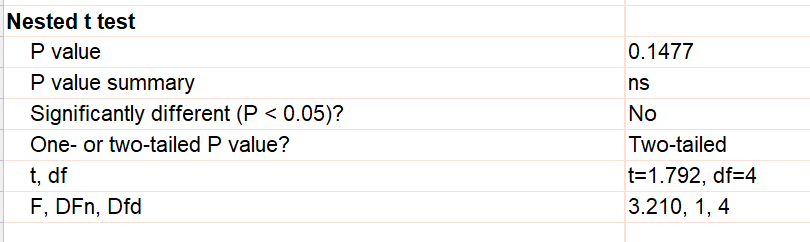
The results are presented to be similar to an unpaired t test. The P value tests the null hypothesis that the two treatment means are identical. The P value can be computed from either a t ratio (matching a t test) or a F ratio (since these kind of data are often analyzed with nested ANOVA). The t ratio is the square root of the F ratio (since the denominator df is zero) so the P value is the same either way. We show both so you can match other programs or texts
Confidence interval
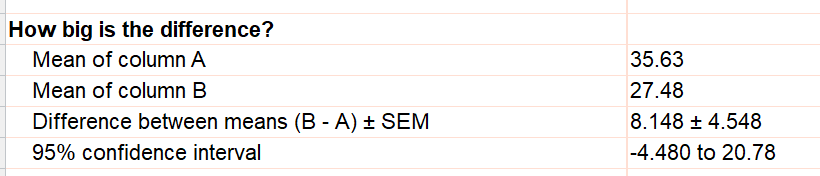
The most important result is the 95% confidence interval for the difference between two means. You can ask for 90% or 99% confidence intervals in the dialog if you prefer.
Other results (that most scientists will ignore)
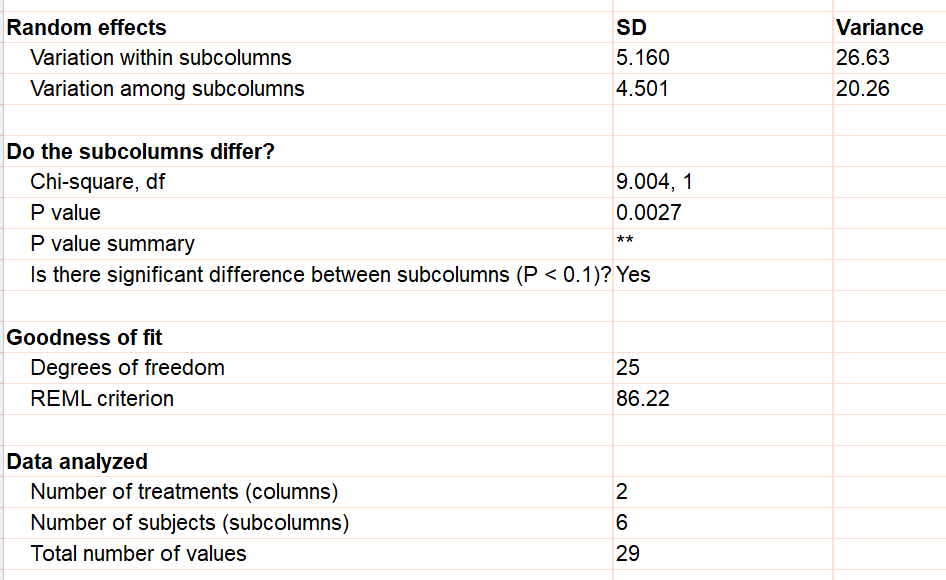
The nested t test fits a mixed model. It is called mixed because the values stacked in subcolumns and the choice of subcolumns are assumed to be random, while the treatment (teaching method, for this example) is fixed. This means we care about testing these two teaching methods, but the choice of schools and students within schools is random. We don't care about those particular students or those particular schools. The model fits the variation within subcolumns and between subcolumns and reports these as both the variance and the standard deviation (which is the square root of variance). Prism reports these so you can compare with other programs or texts. Those values are not so helpful.
You put the students into different subcolumns because you expect the results in different classrooms to be distinct. Prism tests the null hypothesis that in fact all the subcolumns (schools) within a column (teaching method) are identical. Here that P value is 0.0027 so you can reject that null hypothesis. This test is of marginal usefulness.
Prism optionally reports the REML goodness of fit to match other programs and books. There is no point trying to interpret it.