Example data
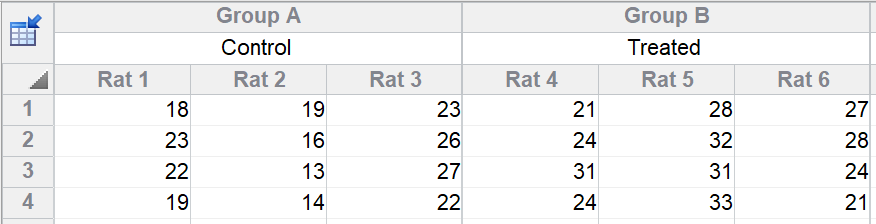
This example analyzes the data shown earlier with replicate rats, each with multiple measurements (technical replicates).
Results of nested t test
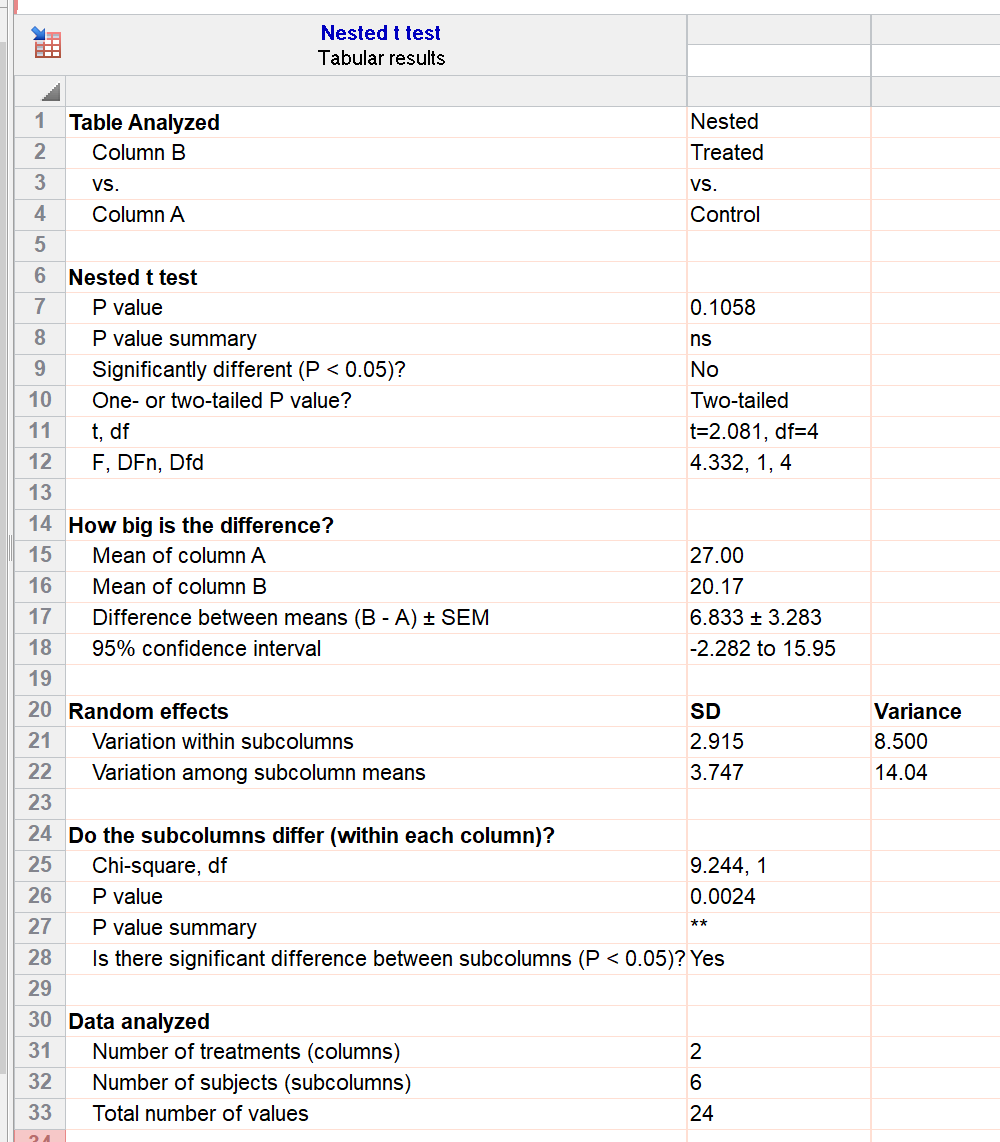
The 95% confidence interval for the difference between control and treated means range sfrom -2.3 to 15.9. The P value testing the null hypothesis of no difference between the two populations is 0.11. These data do not provide convincing evidence of a treatment effect.
The P value testing the null hypothesis that all the subcolumns (within each column) are identical is 0.0024. That provides evidence that the rats vary from one another.