Survival analysis is the process of examining the amount of time that passes until a specific event of interest occurs. In many experiments (especially those in the biological sciences), the event of interest is often the death of a subject (a mouse, a cell, etc.) in the study. The response variable for these experiments is the elapsed amount of time that the subject survived (giving this analysis its name). However, survival analysis is equally applicable to other sorts of experiments looking at time to event data, such as those measuring the amount of time that a mechanical part is used until it breaks or fails, or measuring the amount of time that it takes for a student to earn a degree. In these cases, the analysis may go by different names (in economics, these analyses may be called “duration analyses” or “duration modeling”; in sociology, these studies may be called “event history analyses”). However, all of these analyses are fundamentally the same.
One of the primary outcomes of survival analysis is understanding how the probability of survival changes over time. This relationship can be presented graphically in the form of a survival curve. These curves are generated for a given population, and plot elapsed time on the X axis, with survival probability (either as a fraction or a percent) on the Y axis. Thus, the position of the curve is defined as the probability that an individual in the relevant population can "survive" for the given amount of time without experiencing the event of interest. Consider the example survival curve shown below:
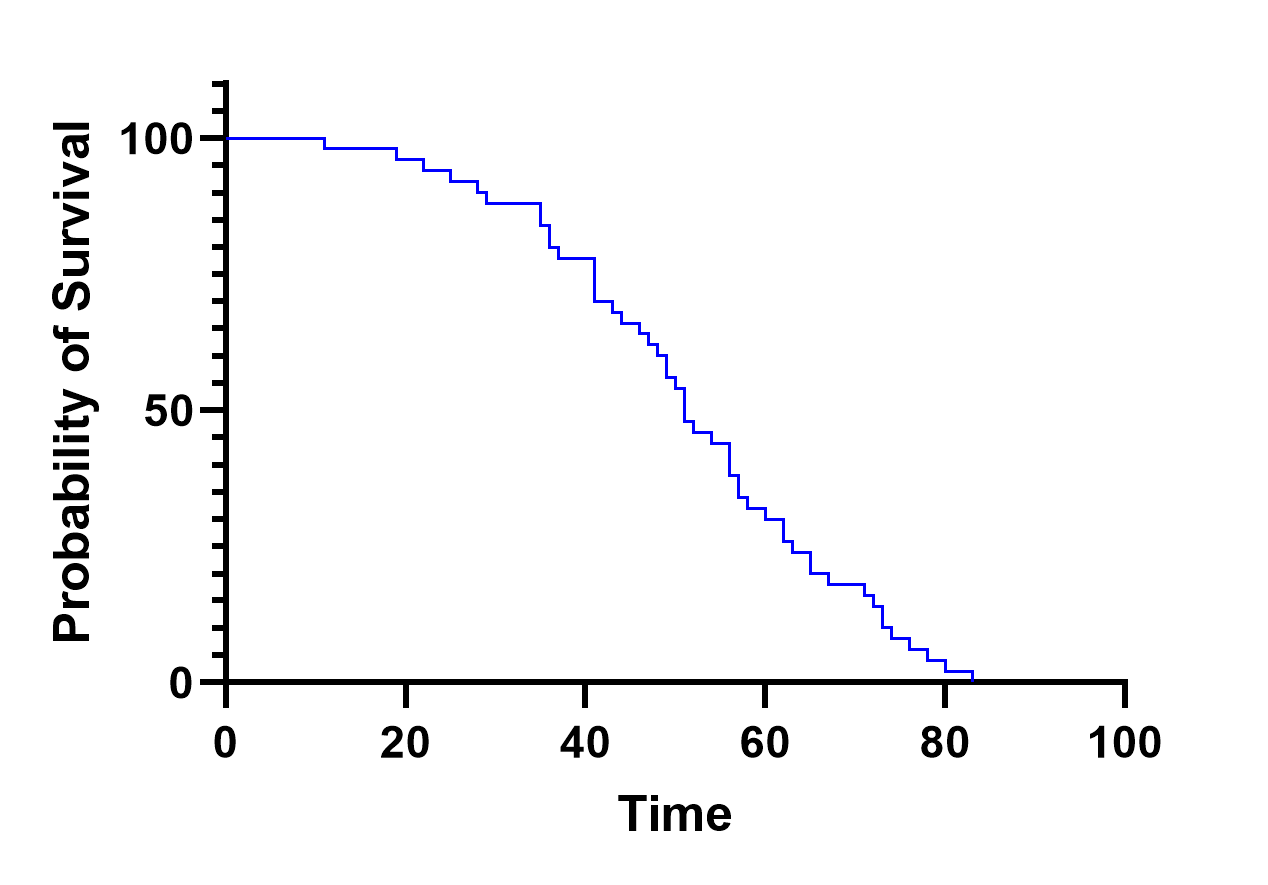
In this graph, we can see the classic "stair-step" slope of the survival curve. Survival probability is given as a percentage in this graph, starting at 100% at time zero and ending at 0% around time 83 days. The "stair-step" shape is a result of the way the survival probability is calculated: the survival probability only changes at the point when someone in the population experiences the event of interest (when the event of interest is death, these are the time points that an individual dies), so each of those vertical drops represents an event in the studied population. These graphs can then be used to determine important information about a single population such as median survival time, or to statistically compare multiple populations each with their own corresponding survival curve.
The curve above was created using the Kaplan-Meier method, and this section of the guide explains how to perform Kaplan-Meier survival analysis in Prism.
Another survival analysis technique - Cox proportional hazards regression - is also available within Prism, and this section of the guide explains how it can be performed.