In survival analysis, the response variable is the amount of time elapsed between some defined “start time” and some other defined “end point”. This elapsed time is very often referred to as the survival time, since a common “end point” in these types of studies is the death of a subject. With almost any type of survival analysis, the primary objective is to estimate or understand the relationship between this response variable and one or more predictor variables. These predictor variables may be things that are specified by the experimental conditions (such as receiving one treatment vs a different treatment or a control), or they may be observational variables (such as the gender of a study participant).
As an example, survival analysis may be used to examine the effects of a new cancer treatment by measuring the survival time of individuals receiving the new treatment compared to those in a control group receiving a standard treatment. By comparing the survival times of individuals in each group, information about the efficacy of the new treatment may be gained.
As another example of survival analysis, imagine that you work for a company that manufactures a laboratory device used in different laboratories across the country. You’ve been tasked with studying the failure of a specific component within the device. In addition to measuring the amount of time that each device is used leading up to the failure of the component, you may also record the ambient temperature and relative humidity inside each laboratory (let’s assume these don’t change over time). In this example, survival analysis would allow you to examine potential relationships between temperature (or humidity) and the time to failure of the component within the device.
Once the relationships between the predictor variables and survival time has been established, this information may also be used to estimate the survival probability for other subjects or individuals over time (assuming that values for the predictor variables for these individuals are known).
That sounds a lot like multiple linear regression
If you’re familiar with multiple linear regression models, it may seem that survival analysis is trying to accomplish the same goal (i.e. uncover the relationships between some measured response variable and some set of predictor variables). And as will be shown later in this guide, there are some similarities between multiple linear regression and some survival analysis techniques (see: Cox proportional hazards regression). However, there are some important characteristics of survival data that result in typical multiple linear regression approaches not being appropriate for the analysis of this sort of data.
Survival data are often highly skewed
As mentioned previously, the response variable for survival analysis is the elapsed amount of time for each observation (subject, individual, etc.) until some defined endpoint is reached. This has some important implications for the distribution of values in the response variable. First, since we’re measuring elapsed time, all of the values are positive (there is no “negative time” in survival analysis). Second, when observing or sampling survival times, the values obtained are generally highly skewed. Consider the histogram below displaying the survival times for a group of 5000 observations
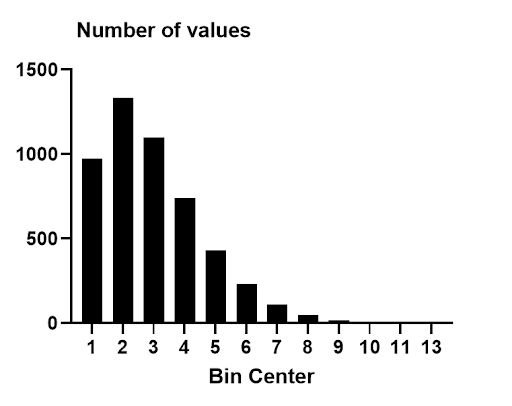
A large portion of the survival times are found between times 1 and 3 (almost 70% of the observed survival times fall into this range). However, there were multiple observations as far out as time 13. These values on the right-hand side of the histogram are said to give the distribution a “large right tail” or that the distribution is “right-skewed”. These data are simulated, but show the characteristics of a right-skewed distribution that is often observed in real survival data. Because of this skew, many of the assumptions and techniques relying on a normal (Gaussian) distribution cannot be used.
Censored data
The other major distinction between survival analysis and standard linear regression techniques is the prevalence of censored data. This is such an important topic in survival analysis that it's been given its own page in the guides.