Features and functionality described on this page are available with our new Pro and Enterprise plans. Learn More... |
There are a number of important options to consider when performing a K-means clustering analysis. These include:
1.How to normalize or scale the data
2.What distance metric to use
3.Which calculation/iteration algorithm to use
4.How many clusters to use!
5.How to specify the initial cluster centers
This page discusses the options available for these three aspects of the analysis, as well as options for defining clusters from the analysis.
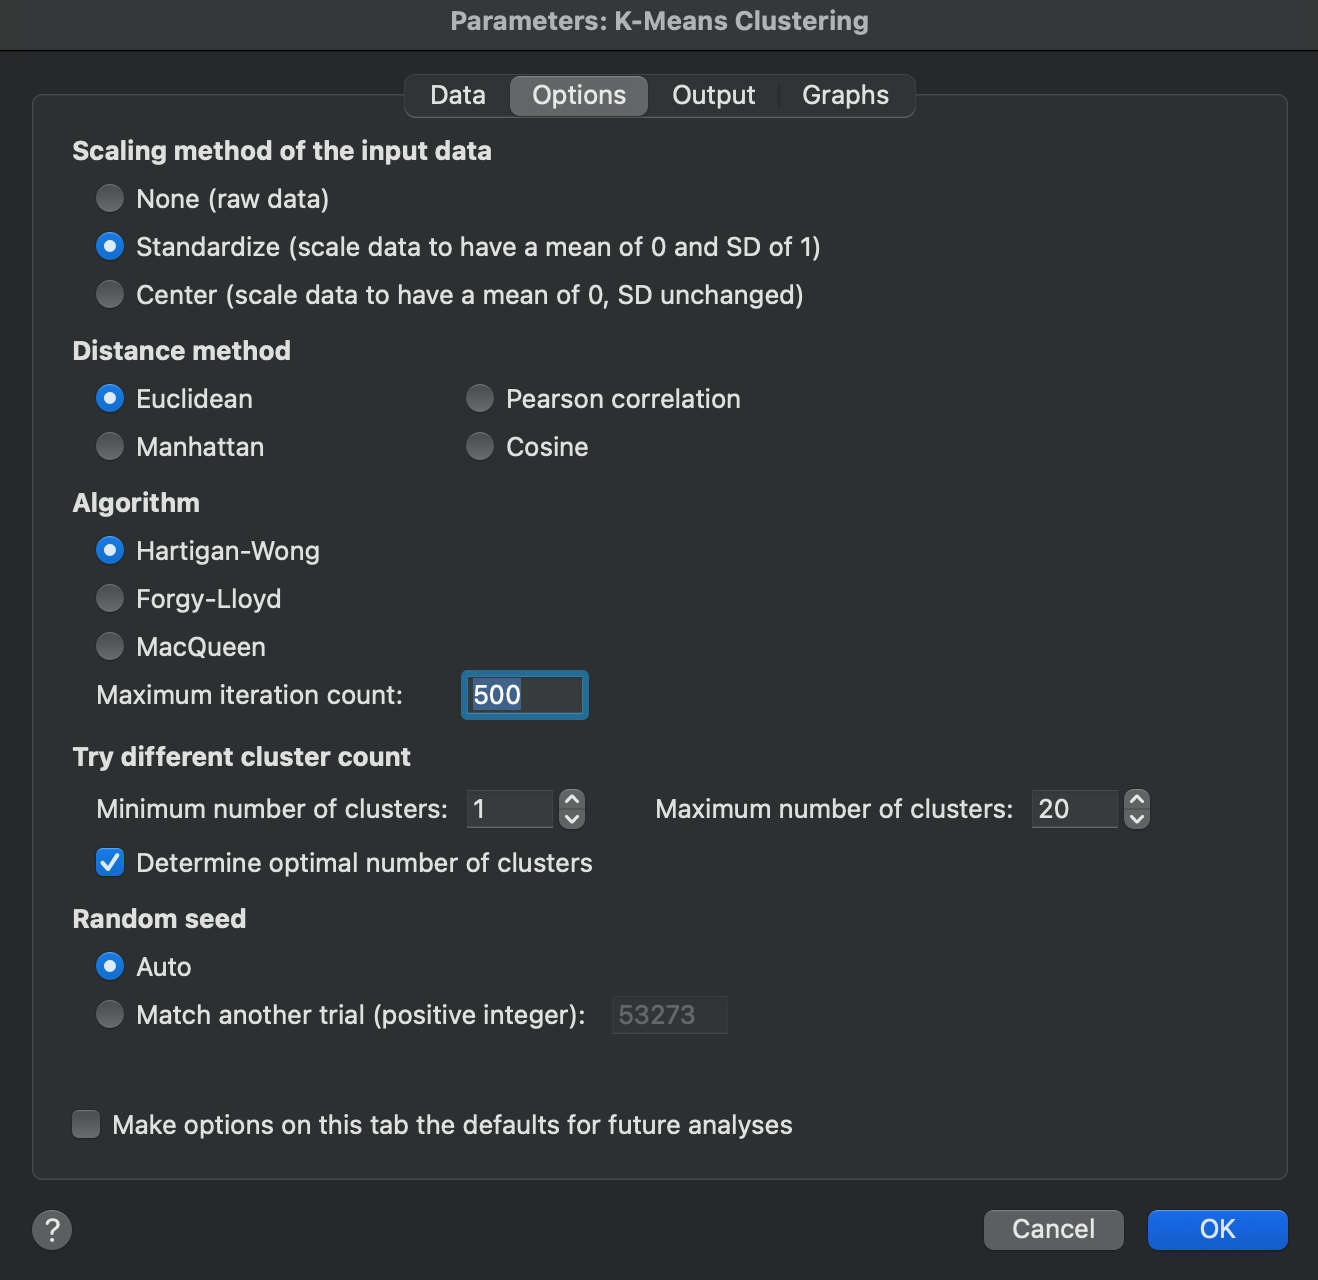
Scaling method of the input data
These options instruct Prism how the input data should be transformed prior to conducting the clustering analysis. Because K-means clustering is performed on the rows (observations) of the input data, the scaling method selected here will be applied to the variables (columns) of the input data table. There are three options for scaling the values of the columns of the input data:
1.None - don’t transform the data at all and use the raw data
2.Center - transform the data so that it has a mean of zero, but the standard deviation is unchanged. For this scaling method, the column mean is subtracted from each value in that column.
3.Standardize - transform the data so that it has a mean of zero and standard deviation of one. For this scaling method, the column mean is subtracted from each value, and this difference is divided by the column standard deviation.
Standardization is often used when dealing with variables on vastly different scales to ensure that one variable doesn’t add more “weight” to the analysis than another. If one variable has a huge range of values, while the values of other variables are all relatively close together, then if no scaling or only centering is used, the large values of the single variable with high variance will dominate the distance calculations, potentially masking or eliminating the effect of other variables in the input data.
Distance method
Clustering methods work by determining the distance between objects (observations or clusters) and then grouping the “closest” objects together into a cluster. However, there are multiple different ways to define the distance between two objects. These options allow you to specify which distance method you would like to use for this analysis.
Algorithm
K-means clustering works by first defining the number (K) of clusters into which the observations of your data will be grouped. Then, cluster centers are defined for each of the K clusters defined. This step is called the initialization step, and is discussed a bit more below. Finally, an algorithm is used to iteratively assign observations to each of the clusters and update the location of the cluster centers appropriately. There are a number of different algorithms that can be used for K-means clustering, each with their own approach, advantages, and disadvantages. Prism offers the choice of three:
1.Hartigan-Wong - this is the most commonly utilized algorithm across multiple different stats packages and applications. It is the default for K-means clustering analysis in Prism. The objective of this algorithm is to minimize the within cluster sum of squares. As part of this algorithm, observations are iteratively assigned to new clusters if and only if the new assignment reduces the overall within cluster sum of squares (suggesting a more compact cluster).
2.Forgy-Lloyd - sometimes also referred to as the Lloyd-Forgy algorithm, this is the oldest and arguably simplest algorithm. This algorithm attempts to minimize the distance of each observation to its cluster center, and works by iteratively assigning each observation to its closest cluster center. Once all points have been assigned, the location of the cluster centers are recalculated and the process is repeated.
3.MacQueen - this is a slight improvement over the Forgy-Lloyd algorithm, but is very similar. It also attempts to minimize the distance of each observation to its cluster center, but differs from Forgy-Lloyd by updating the location of the cluster center after each reassignment of any observation (not waiting until all observations have been assigned).
For each of these algorithms, you may choose to specify a maximum number of iterations that will be attempted. If the analysis does not reach convergence by this point, the results are reported as they were determined after this number of iterations.
Define the number of clusters
One of the most important aspects of performing K-means clustering is defining the number of clusters into which your data should be grouped. Because K-means clustering is an unsupervised machine learning technique, there’s no labels or identifiers that are used to group your observations into clusters. The K-means algorithm simply tries to assign each observation to the most appropriate cluster. But in order to do this, the algorithm must first know how many clusters it is sorting the data into.
Instead of simply picking a single value to use for the number of clusters, Prism allows you to specify a minimum and maximum number of clusters to apply to your data. Using these two endpoints, Prism will repeat the clustering analysis using every possible number of clusters in between, and will report results for each fit. Obviously, you cannot have zero clusters, and you cannot have more clusters than there are observations. As such, the smallest value you can enter for the “minimum” is 1, and entering any value larger than the number of observations in the input data will result in an error when Prism attempts to perform the analysis.
Determine optimal number of clusters
In addition to manually specifying a range of cluster numbers to test, Prism also offers an automated approach to determine the optimal number of clusters for your data (and other analysis options). When you check the "Determine optimal number of clusters" option, Prism will evaluate multiple clustering solutions and recommend the best number of clusters based on statistical consensus.
This feature uses a consensus method that applies 17 different statistical methods to evaluate each possible number of clusters within your specified range. Each method calculates its own metric to assess cluster quality, and determines what it considers the "optimal" number of clusters based on that metric. A set of separate pages cover the details of each of these metrics with additional mathematical details.
Once all of the methods have been evaluated for your data, Prism identifies the cluster number that is more frequently recommended as "optimal" across all methods. This consensus approach provides a more robust recommendation than relying on any single metric alone.
When this option is selected, you will find two additional components in the results of the analysis:
1.A new section on the Tabular results tab of the results titled "Optimal number of clusters". Within this section, you will find a summary of the consensus method, including:
a.The best cluster count determined by the consensus method
b.A list of metrics/methods used
c.The optimal cluster count determined from each method
d.The metric value corresponding to each method for the given optimal cluster count
2.A new "Cluster metrics" results tab that provides a detailed grid showing the metric values calculated by each of the 17 methods for each tested cluster number. This allows you to examine how different methods evaluated each clustering solution, and to understand the basis for the consensus recommendation.
This automated approach is particularly useful when you're unsure how many clusters exist in your data, or when you want some statistical validation for your choice of cluster number.
Choosing initial cluster centers
In order for K-means clustering to be performed, one of the first steps is to define the initial location of the cluster centers so that the iterative process of assigning observations and updating the location of the cluster centers can be completed. This process is known as initialization, and the way Prism performs initialization is with a process called K-means++. The details are described on another page, but essentially, this selects k observations from the input data (where k is the specified number of clusters) and uses those as the initial cluster centers. Because this process of initialization involves some random selection, it’s possible that repeating K-means clustering on the same data with the same parameters may lead to slightly different results. This is due to the fact that when K-means algorithms converge, they may converge at a local minimum rather than a global minimum. When two analyses on the same data start with cluster centers at different locations, it’s possible that they converge at different local minima.
To ensure that results are perfectly reproducible, Prism allows you to specify a random seed that will be used when selecting the initial cluster centers. If the same random seed is specified for an analysis with the same parameters on the same data, the results of these two analyses will match perfectly.