Features and functionality described on this page are only available for subscriptions that use email-based named-user licenses. |
The need for multiple comparisons
When you compare three or more survival curves at once, you get a single P value. This P value is used to test the null hypothesis that all of the subjects in each of the different groups were sampled from a single population with a single survival profile, and that any differences in the survival of each of the groups was due to random sampling. However, instead of looking at the null hypothesis that all of the groups were sampled from a single population, you may be interested in comparing two specific groups at a time, or assessing all possible pairwise comparisons. Prism offers controls for setting up multiple comparisons following survival analysis of three or more groups in the survival analysis dialog.
Results of multiple comparisons for survival analysis in Prism
Starting in Prism 10.5, Prism will calculate and report the results of multiple comparisons for Kaplan-Meier survival analysis automatically. These multiple comparisons results can be found on their own tab of the results sheet.
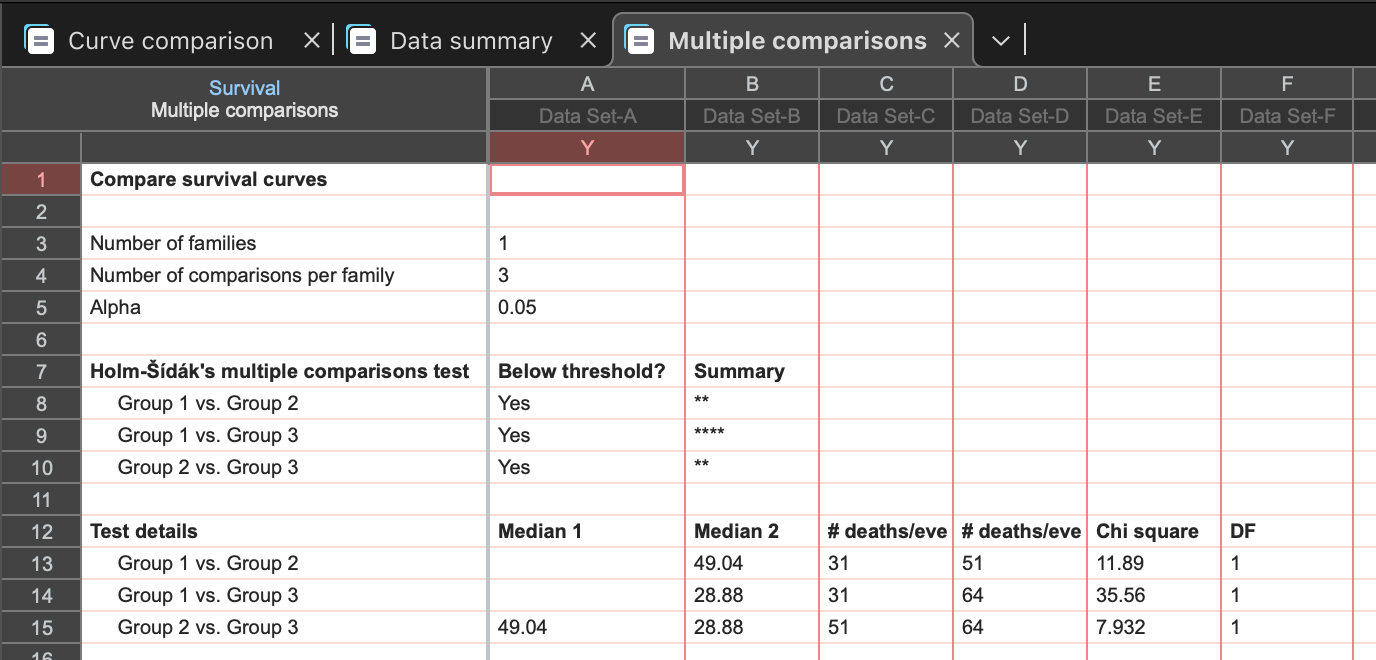
This results sheet is structured similarly to other multiple comparisons results sheets in Prism (for example, for one-way and two-way ANOVA). The first section of this sheet simply provides information on the number of comparisons being made (number of comparisons per family) and the alpha specified in the parameters dialog.
The next section provides information on the individual tests, the correction method used, and a summary of the comparison (was the obtained P value smaller than the specified threshold). Optionally, this section will also include the calculated multiplicity adjusted P value for each comparison.
The final section of this results tab includes test details for each comparison, including the median of each group (if it could be calculated), the number of events for each group, and the chi square statistic for the individual comparison.
How multiple comparisons of survival curves work
Multiple comparisons tests after ANOVA are complicated because they not only use a stricter threshold for significance, but also include data from all groups when computing variance (scatter), and use this value with every comparison. By quantifying scatter from all groups - not just the two you are comparing - you gain some degrees of freedom and subsequently some additional power.
Multiple comparisons tests for comparing survival curves are simpler. You simply have to adjust the threshold for determining when a P value is “small enough” to reject the null hypothesis, and don’t need to take into account any information about the groups not included in the comparison (as this information would not be helpful).
Performing multiple comparisons manually (NOT recommended)
Performing multiple comparisons following survival analysis can technically be done manually by copying the data for each group into a new Survival data table (or duplicating the existing table and adjusting which groups should be included in the analysis). However, if you don’t adjust for multiple comparisons after doing this, it is easy to obtain P values that fool you into believing that the null hypothesis that these groups were sampled from a single population can be rejected. If you perform many pairwise comparisons, the chances are high that one or more pair of groups will generate a P value below the specified threshold (and thus suggesting a rejection of the null hypothesis) purely by chance. To protect yourself from making this mistake, you should correct for multiple comparisons.
Comparing survival curves two at a time with Prism
For each pair of groups you would like to compare, follow these steps:
1.Start from the results sheet that compares all groups
2.Right-click the analysis sheet in the Navigator or click the “New” button in the Sheet section of the toolbar, and select “Duplicate current sheet”
3.The Analyze dialog will appear. On the right side of this dialog, select the two groups you wish to compare and make sure that all other groups are unselected. Click OK
4.The survival analysis parameters dialog will appear. Click OK without changing any settings
5.Note the P value (from the logrank or Gehan-Breslow-Wilcoxon tests), but do not make an attempt to interpret this P value until you correct for multiple comparisons (explained in the next section)
6.Repeat the steps above for each set of pairwise comparisons you would like to make. Alternatively, open the “Change” menu and select “Data analyzed…”. The Analyze Data dialog will appear and you can specify a different set of groups to be compared
How to correct for multiple comparisons
When you are comparing multiple pairs of groups at once, you can’t directly interpret the individual P values in the usual way. Instead, you must adjust the threshold against which the P values are being compared to determine if the null hypothesis can be rejected.
The simplest approach to make this adjustment is to use the Bonferroni method. Note that this is something you’ll do manually by performing several separate survival analyses. It does not involve performing ANOVA.
1.Define the alpha threshold (“significance level”) that you want to apply to the entire family of comparisons. This is conventionally set to 0.05
2.Count the number of comparisons you are making, and call this value K (see the next section which discusses some ambiguities)
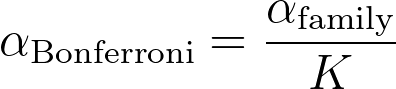
3.Compute the Bonferroni-corrected α value that will be used for each individual comparison. This equals the family-wise alpha level (defined in step 1, typically 0.05) divided by K
4.If a P value is less than this Bonferroni-corrected threshold, then the null hypothesis (survival profiles of these two groups are the same) can be rejected. Another way to state this is that the comparison is “statistically significant” using the family-wise significance level of 5%
How many comparisons are you making?
You must be honest about the number of comparisons that you are making when performing pairwise comparisons of survival data. Assume there are four treatment groups (including a control). After looking at the data, you go back and compare the group with the longest survival with the group with the shortest survival. It is not fair to say that you are only making one comparison since you couldn’t know which comparison to make without first looking at the data. With four groups, there are six possible pairwise comparisons you could make. By first looking at the data to select this one comparison, you have implicitly made all six of these comparisons and should define K as 6 in step 3 above.
If you were only interested in comparing each of the three treatment groups to the control, but weren’t interested in comparing the treatments to each other, then you would only be making three comparisons and the value of K should be set to 3.