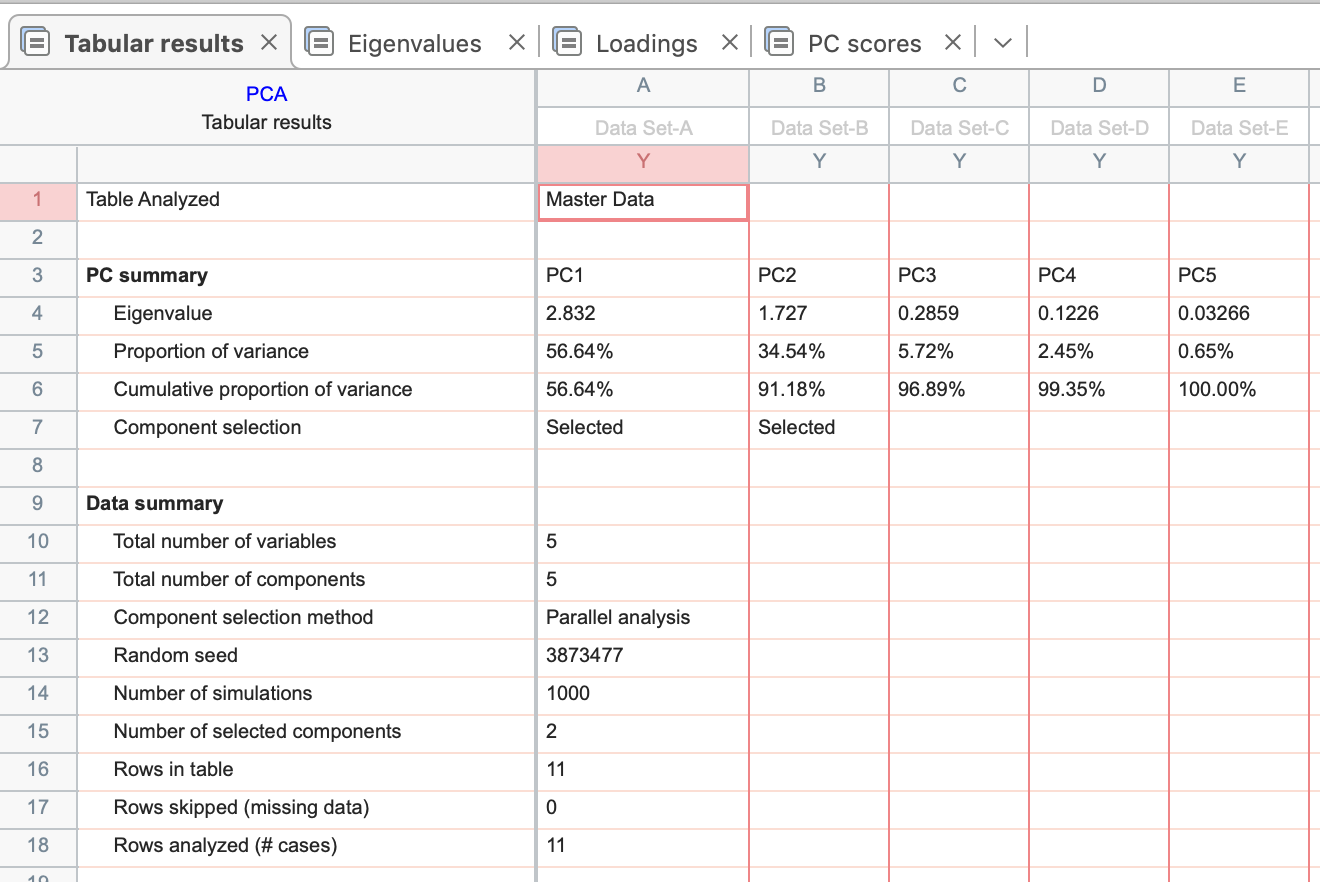
The tabular results view of the results summarizes the analysis, and provides all of the information most scientists need. First, the eigenvalues for each of the PCs are listed, and from these the proportion of variance for each PC individually - as well as the cumulative proportion of variance for each PC and all previous PCs. For example, PC3 has an eigenvalue of 0.2859. This corresponds to a proportion of variance for PC3 of 5.72% of the total variance in the data, and a cumulative proportion of variance explained by PCs 1, 2, and 3 of 96.89% of the total variance in the data.
This view also indicates which components were selected (PC1 and PC2) along with a Data summary section with all of the relevant information from the analysis. In this section, we can see that the original data contained 5 variables and 11 observations (no missing data), 5 total components were generated, Parallel analysis was chosen, which resulted in selection of two components.