Now that we’ve covered a good portion of the theory PCA and the concepts on which it relies, let’s go back to our previous example to see how some of this plays out. Here is a dataset with five variables, some of which we already saw were correlated and some which are not.
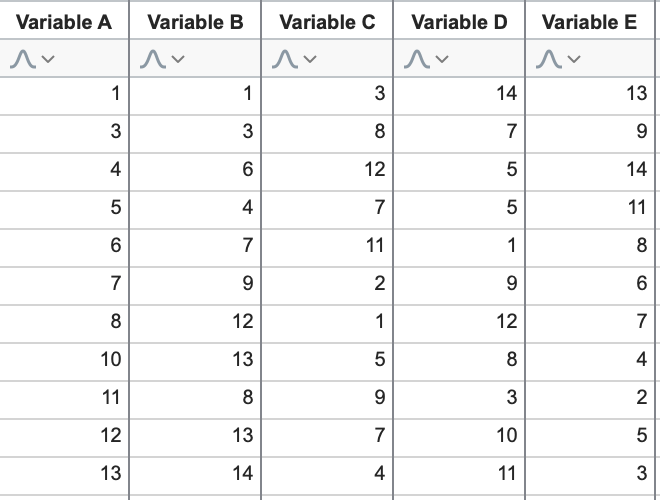
Using this data and Prism, we can perform PCA using all of the default options (standardized data, PC selection via parallel analysis), but choosing to show all available graphs (including the Scree Plot and Proportion of variance graph). Note that, by default, Prism does not include a table of standardized (or centered) data as a results table, but you can choose to show this if you’d like.