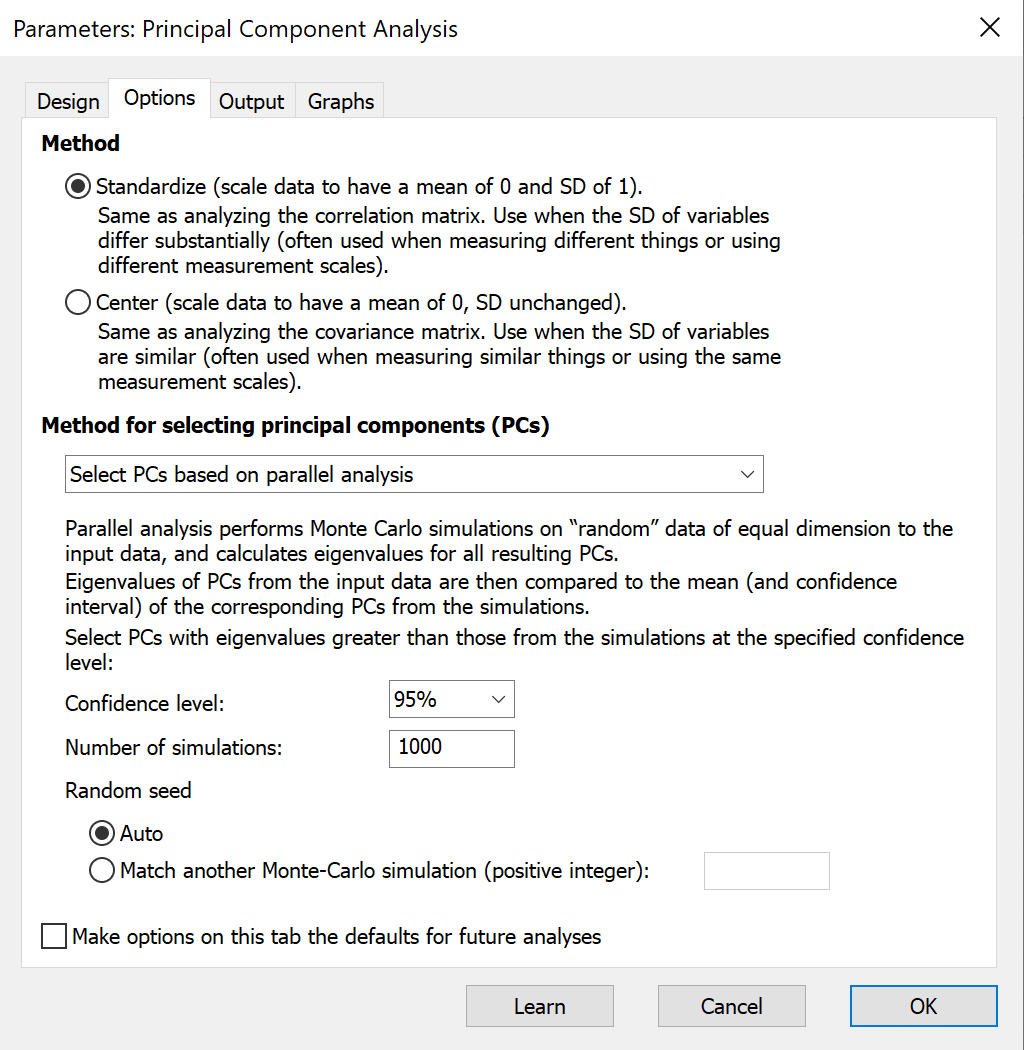
In the options tab of the dialogue, you need to make two major decisions that can heavily influence the results and conclusions of PCA. Unless you understand why you need to do otherwise, we recommend performing PCA on standardized data and using Parallel Analysis to select the number of components.
Method
The most important decision is whether to perform PCA on standardized or centered data.
PCA on standardized data
Unless you have a specific reason to do otherwise, this is the recommended approach. It’s sometimes referred to as performing PCA on the correlation matrix. You would almost always choose this approach if your variables were measured using different units.
How it works: Before performing PCA, variables are transformed so that each variable has a mean of 0 and standard deviation of 1. This puts all the variables on the same scale, so that when the PCs are found, each variable is weighted equally. Mathematically,
Xstandardized = (Xraw - X̄)/sx
where X̄ is the mean and sx is the standard deviation of the variable values.
PCA on centered data
If all of your variables are in the same units, then you may want to perform PCA on centered data, also called PCA on the covariance matrix. There are times when this is the appropriate choice, but it’s rare.
How it works: Before performing PCA, variables are transformed so that each variable has a mean of 0, with an unchanged standard deviation. Because the variables aren’t scaled, variables with larger standard deviations than the others will primarily drive the calculation of the first principal components. Mathematically,
Xcentered = (Xraw - X̄)
where X̄ is the mean of the variable values.
Method for selecting the number of principal components
Selecting principal components is the process which determines how many "dimensions" the reduced dimensionality dataset will have following PCA. In some cases, Prism provides results only for the selected PCs (Loadings, Eigenvectors, Contribution matrix of variables, Correlation matrix of variables and PCs, PC Scores, and Contribution matrix of cases).
Prism offers four approaches to select the number of principal components:
Parallel analysis (recommended)
Parallel analysis is an elegant, simulated procedure to select the number of PCs to include by determining the point at which the PCs are indistinguishable from those generated by simulated noise. Here is the process for how Parallel Analysis works:
1.Prism simulates a large number of datasets (1000 is the default, but a different number can be specified). Each simulated dataset contains the same number of variables (columns) and observations (rows) as the input data.
a.For each simulated variable, data are generated by sampling from a multidimensional normal distribution with mean = 0.
b.The standard deviation for each simulated variable is equal to the standard deviation of the corresponding variable in the input data table
2.PCA is performed for each simulated dataset
3.For each PC, the mean eigenvalue is calculated across all simulated datasets
4.For each PC, an upper percentile (95th percentile by default) is calculated using the eigenvalues from all simulated datasets
5.For each PC, Prism compares the eigenvalue from the input data with the upper percentile calculated from the simulated datasets
6.If the eigenvalue from the input data is larger than the upper percentile from the simulated data, the component is selected, else the component is not selected.
Note that if you select parallel analysis for determining the number of PCs, the scree plot will display the simulated eigenvalues along with the eigenvalues from your data.
Select PCs based on eigenvalues
Classically, PCs with eigenvalues greater than 1 were selected. This is called the Kaiser rule. The motivation for using ‘1’ as the cutoff is that with standardized data, the standard deviation (and variance) of each variable is equal to 1. Eigenvalues for PCs represent the variance that the PC represents from the original data. Thus, if the amount of variation introduced by each original variable (or column) is 1, a PC with an eigenvalue less than 1 explains less variation than a single column of data.
Prism also includes options to choose a different cutoff value or to just keep the first k PCs with the largest eigenvalues (k can be specified in the options).
Select PCs based on percent of total explained variance
Another common (classical) procedure to select the number of PCs is to keep the PCs with the largest eigenvalues that cumulatively explain a specified percent of the total variance. Common choices for the target percent of total variance are 75% and 80%.
Select all PCs
A final option is to have Prism report all PCs. This is rarely useful, but may be useful for teaching or niche data exploration.