In this tab, you can customize the output from PCA and define additional variables to include in the results tables. These additional variables can be used for graphing and subsequent analyses.
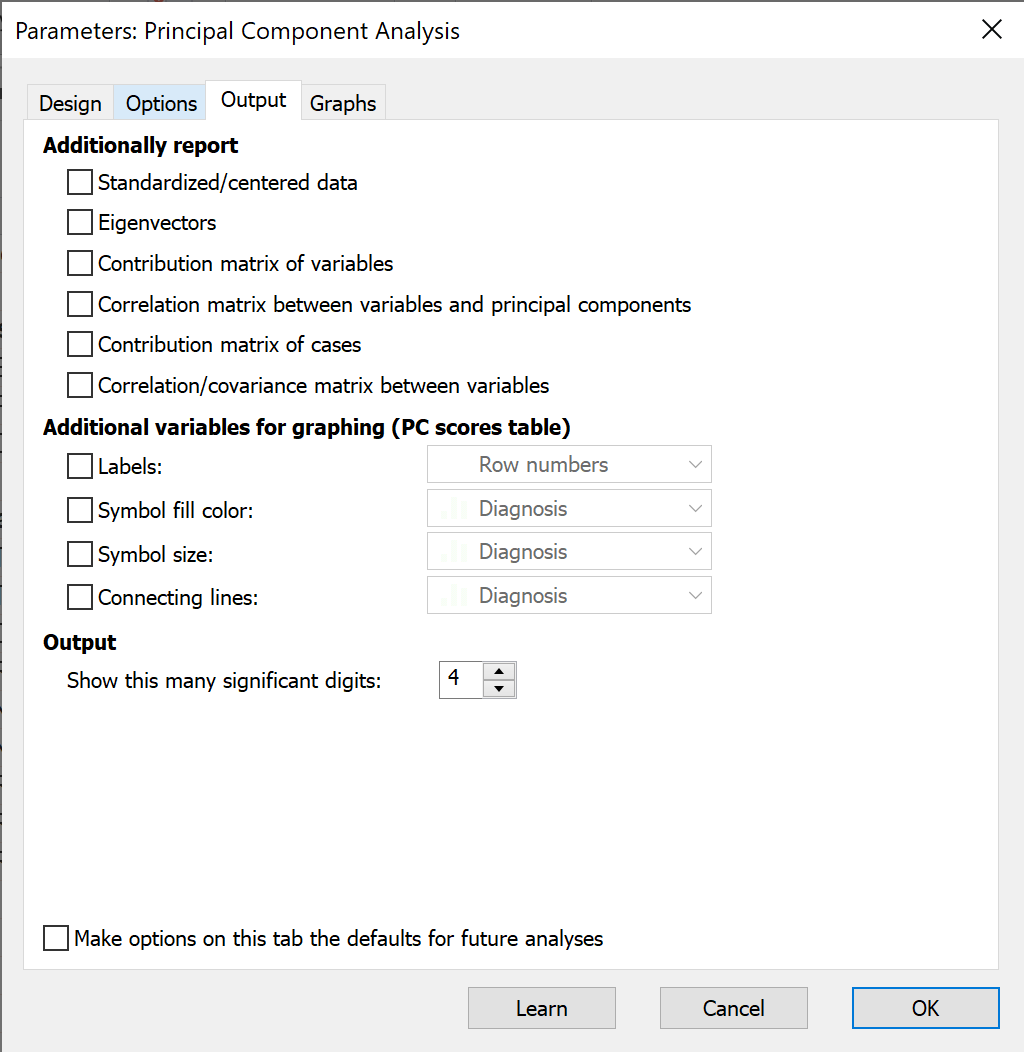
Additionally report
Select whether or not to report optional results tables. Some of these tables include data used in the “background” for calculation, while others are meant for expert users and will not be needed by many Prism users.
•Standardized/centered data. This is the transformed data that actually enters into the PCA calculations.
•Eigenvectors for each PCs. These values provide the coefficients for the linear combination of variables that define each PC.
•The contribution matrix of variables. Each row represents one variable, and each column represents one PC. The values in a single column represent the fraction of total variance explained by that PC that each variable contributes. As such, these values sum to 1.0 (100% of the variance explained by the PC). Numerically, these values are the square of the corresponding values in the eigenvectors table.
•The correlation matrix between variables and principal components. Each row represents one variable, and each column represents one PC. Each value is the corresponding correlation coefficient. For standardized data, this table will be identical to the Loadings matrix.
•The contribution matrix of cases. Each row represents one case (row in the original data table), and each column represents one PC. The values in a single column represent the fraction of total variance explained by that PC that each case contributes. As such, these values sum to 1.0 (100% of the variance explained by the PC).
•The correlation/covariance matrix between variables. Each row represents a variable, as does each column. If the data were standardized, each value is the correlation coefficient between the two variables. The diagonal (where the row and column are the same variable) is always 1.0. This is the same correlation matrix you can get from an analysis of that name. If the data were centered, each value is the covariance between the two variables. In this case, the diagonals represent the variance of the original variables (variance = [standard deviation]2).
Additional variables for graphing (PC scores table)

Choose optional variables to refine the graphs.
•Labels - row identifiers such as the row numbers, names, or ID numbers. These will be placed next to each point.
•Symbol fill color. (categorical or continuous). You can define the color map in the Format Graph dialog.
•Symbol size - for scaling the size of the points on the bubble plot (categorical or continuous). Refine the rules for converting value to size on the Format Graph dialog.
•Connecting lines - for plotting connecting lines among different groups of points on the bubble plot (categorical only). In the Format Graph dialog, you can choose the appearance of the connecting line for each level of the selected categorical variable.
Note that these same settings will also be applied to the Biplot table (and graph) since this visualizations is essentially a combination of the PC Scores graph and the Loadings graph.