Analogous to the contribution matrix of variables, the contribution matrix of cases indicates which rows contribute to the PCs relative to the other rows. Each row represents one case (row in the original data table), and each column represents one PC. Note that only PCs that were selected by the chosen selection method are displayed in this table.
Each row represents one case (row in the original data table), and each column represents one PC. The values in a single column represent the fraction of total variance explained by that PC that each case contributes. As such, these values sum to 1.0 (100% of the variance explained by the PC).
Along with the score plot, this can be useful for identifying outliers or unusual points. For example, row 123 has the largest contribution to PC1.
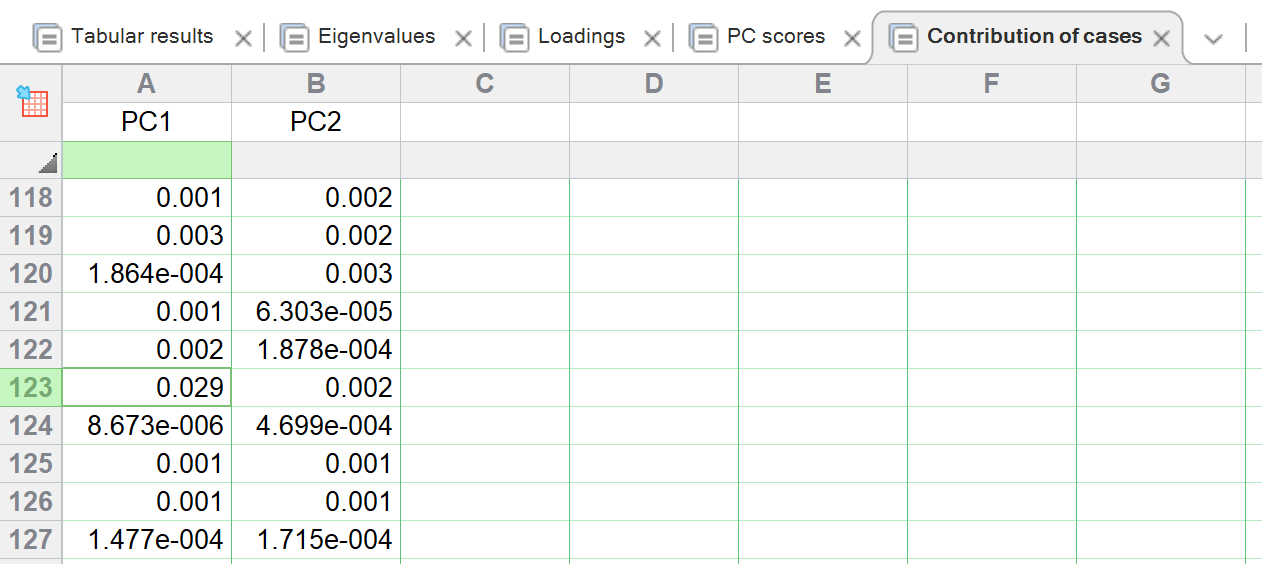
Looking at the PC score plot, this row is the most extreme on the PC scores plot.