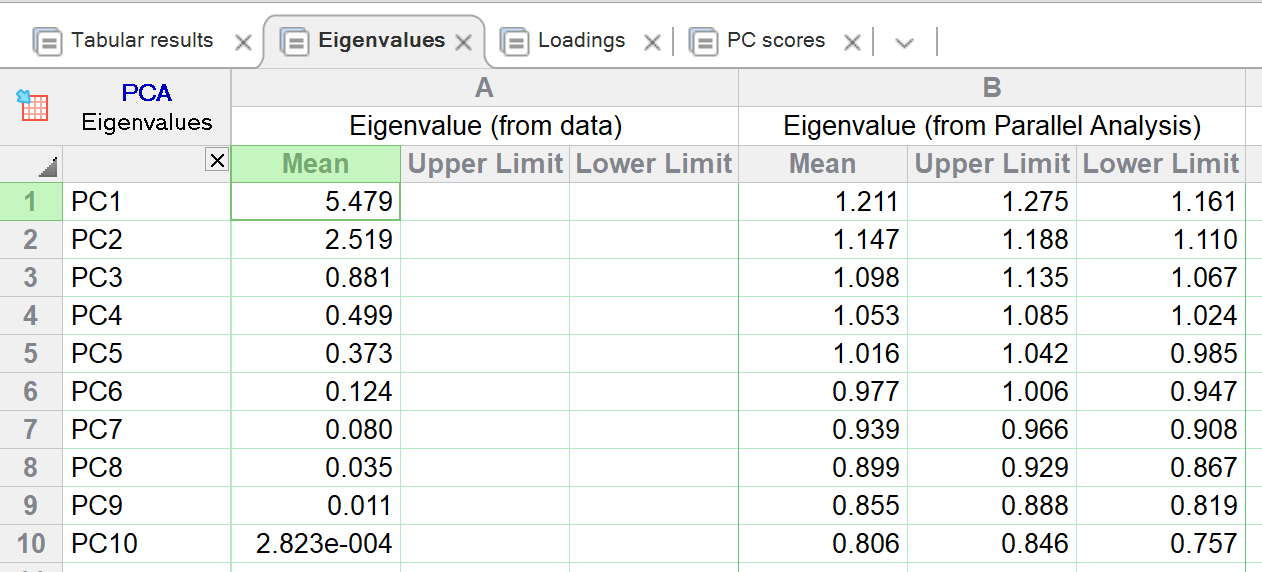
Column A lists the eigenvalues, which quantify the amount of variance explained by each principal component. For reference, they are the squared principal components up to a scaling factor. They are sorted in descending order, so that PC1 explains the most variance, PC2 the next most, and so on. The sum of all the Eigenvalues equals the number of components, which also equals the number of variables (as long as the data have more observations than variables). Eigenvalues for all components are shown, not just the selected components.
Column B is only shown if Parallel Analysis was chosen as the PC selection method for the analysis. This column shows the average (over all simulations) eigenvalue for each PC, and the upper and lower percentile (default being the 95th and 5th percentile) from all simulations.
How are loadings, eigenvectors, and eigenvalues related?
Like this: Loadings = Eigenvector * sqrt(Eigenvalue)