The figure below shows two data sets, identical except for one data point. Clearly, the data set on the right has two outliers, and the one on the left has only one. This conclusion is not at all subtle.
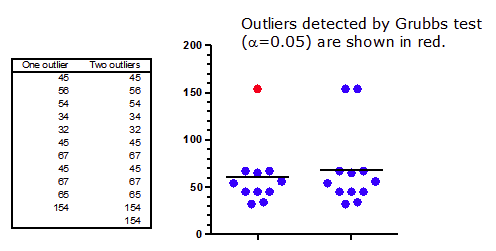
The results of Grubbs' outlier test are surprising. That test (with alpha set to 5%, but the same results are obtained with alpha set to 1%) does identify the outlier in the data set on the left. No surprise there. But Grubbs' test doesn't find any outliers in the data set on the right. The presence of the second outlier prevents the outlier test from finding the first one. This is called masking.
Grubbs' outlier test computes a ratio Z by first calculating the difference between the possible outlier and the mean, and then dividing that difference by the standard deviation. If Z is large enough (considering the sample size), that point is declared to be an outlier. Note that the mean and standard deviation are computed from all the data, including the suspected outlier in the calculations. As the table below shows, the presence of the second outlier (in a small data set) inflates the standard deviation, and so decreases the value of Z to below the threshold used to define an outlier.
Left (one outlier) |
Right (two outliers) |
|
Mean |
60.364 |
68.167 |
SD |
33.384 |
41.759 |
Z |
2.8048 |
2.0554 |
n |
11 |
12 |
Critical Z to define outlier (alpha=5%) |
2.3547 |
2.4116 |
Critical Z to define outlier (alpha=1%) |
2.5641 |
2.6357 |