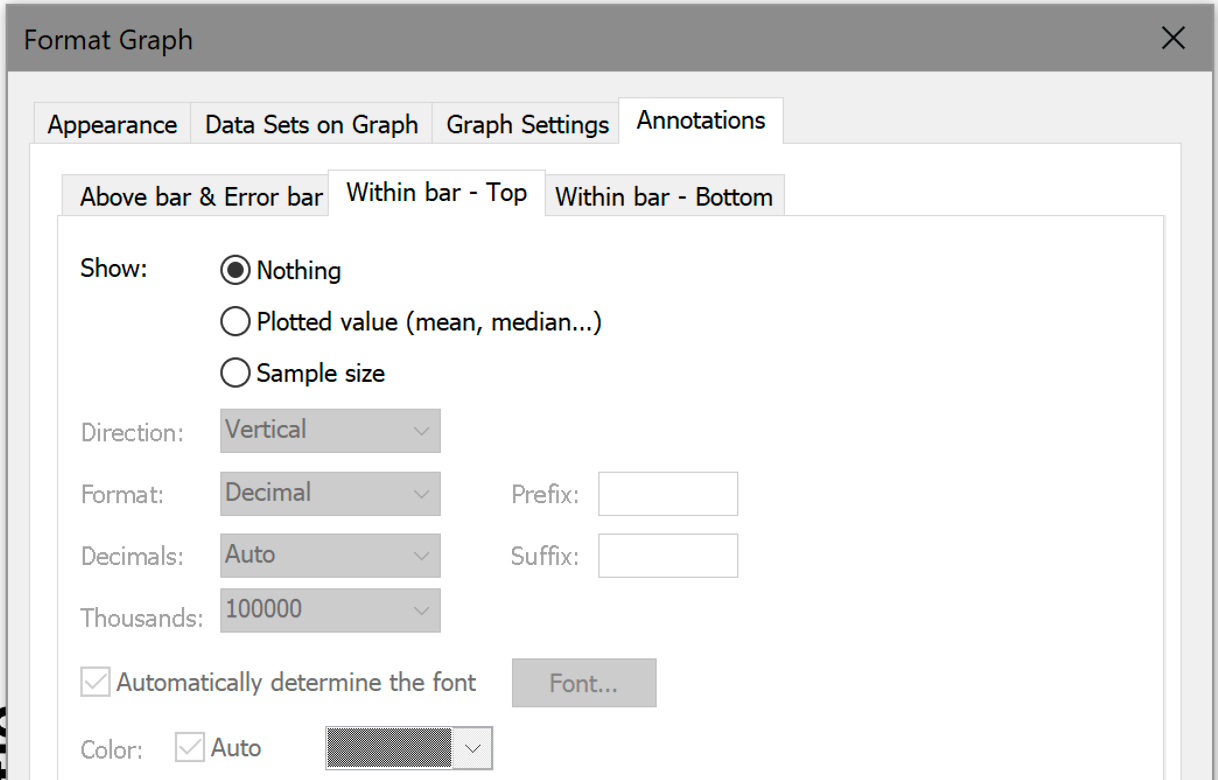
Place the mean/median or sample size within each bar or above. On the Annotations tab of the Format Graph dialog, note there are three tabs within, to specify labeling (if any) above the bars, within the bars on top, or within the bars at the bottom. (Note this feature offers more choices, so a different look, starting with Prism 8.2.)
 .
.
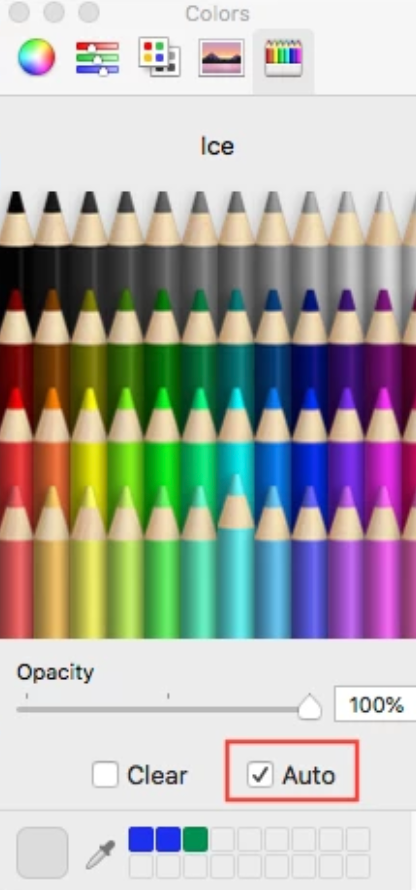
When writing within each bar, choose one color for all values, or choose "auto" so the color is either black or white depending on background. With Prism Windows, the auto choice is in the Format Graph dialog as shown above. With Prism Mac, the auto choice is in the color picker as shown below.