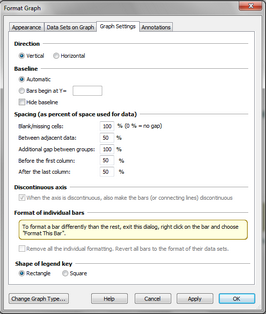
Graph Settings tab of Format Graph dialog
Use the Graph Settings tab of the Format Graph dialog to change the direction of bars on a graph from vertical to horizontal, to set the baseline for graph columns, and to adjust the space between columns. Double-click on any bar to open the dialog.
Rotate columns from vertical to horizontal
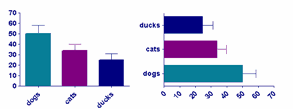
You also can use the Rotate button.
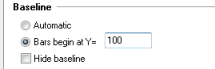
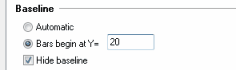
Baseline
Fill in this box to change the baseline for bars on a graph. The default is for the bars to begin at the X axis.
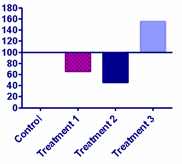
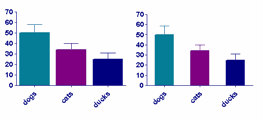
Check the box for "Hide Baseline" if you want your bars to float as in the example below.
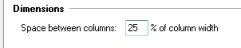
Dimensions
Prism automatically adjusts the width of columns based on the size of the graph, the number of data sets, and the gap between bars which you set here. To make the columns wider, make the spacing smaller.
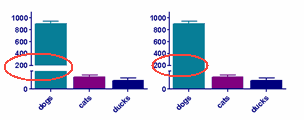
Discontinuous axis
When you have a gap in a Y axis, choose whether or not you also want a gap in any columns that span the gap.
Reset any individual bar formatting
If you have changed the format of individual bars (by right clicking on them) , check an option here to reset everything back to the format set in the dialog.
Shape of legend key
If you are plotting bars and chose to have a legend key, then choose here if the box showing the bar color and fill should be square or rectangular.