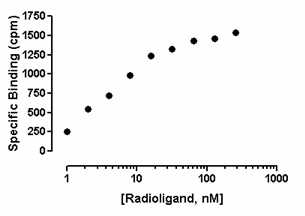
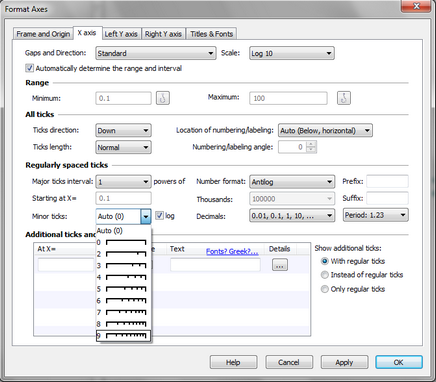
This page shows how to stretch the axis to a logarithmic scale (which doesn't alter your data). Distinguish this from transforming your data to logarithms, which you can plot. To create a log axis: Double-click on the axis to open the Format Axes dialog. In the Scale section, set the axis to Log10 or Log 2 or Ln (natural logarithm). This graph shows log10 spaced minor ticks. The minor ticks between the major ticks at 10 and 100 show the position of 20, 30, 40, 50, 60, 70, 80 and 90. Since the minor ticks are not equally spaced on the graph, we call these log spaced minor ticks. Note that there are eight ticks, so nine intervals (many people mistakenly think there ought to be ten).
To set the numbering for a log10 axis: Double-click on the axis to open the Format Axes dialog and set the number format in the Numbering or Labeling section. Prism offers four numbering format choices for log10 axes. Antilog: 10, 100, 1000, 10000, etc. Scientific: 1x101, 1x10², 1x10³, 1x10⁴,etc. Power of 10: 101, 102, 103, 104,etc. Log: 1, 2, 3, 4, etc.
To set the numbering for a ln axis: Double-click on the axis to open the Format Axes dialog and set the number format in the Numbering or Labeling section. Prism offers three numbering format choices for log10 axes. Scientific: 1x101, 1x10², 1x10³, 1x10⁴,etc. Power of e: e1, e2, e3, e4,etc. Ln: 1, 2, 3, 4, etc. To set the minor tick intervals for a log axis: Double-click on the axis to open the Format Axes dialog and set the number format in the Numbering or Labeling section. Choose Equal or Log spacing, and the number of intervals you want between major ticks, not the number of ticks.
|